 BambooForge Labs
Report Builder Pro with Pivot, Drill-down and Excel Export
Nested pivot and cross-tab reports on any model, without code: follow links between records, add computed columns, highlight what matters, click any number to open its records, keep your own variants, export to Excel and PDF, email on a schedule. 40 ready reports and a daily history of balances.
Available for Odoo 16.0, Odoo 17.0, Odoo 18.0, Odoo 19.0, Odoo 20.0. Technical name bambooforge_report_builder.
Transcript of the walkthrough (Odoo 20)
Report Builder Pro with Pivot, Drill-down and Excel Export. Nested pivot and cross-tab reports on any model, without code: follow links between records, add computed columns, highlight what matters, click any number to open its records, keep your own variants, export to Excel and PDF, email on a schedule. 40 ready reports and a daily history of balances. Odoo's pivot answers one question at a time and forgets the answer.
This app builds reports: tables that nest as deep as you like, run a second field across the top, follow links from one record to the next, work columns out from other columns, highlight what matters, open the records behind any number - and that every reader can bend and keep as a variant of their own. In the next few minutes: report builder pro with pivot, drill-down and excel export, then what you get, then the gallery, then reading a report, then variants - your own way of looking, kept. Then what this app deliberately does not do, so you can tell before you buy whether it fits. Everything lives under Reports then Reports then Schedules.
Report Builder Pro with Pivot, Drill-down and Excel Export. Odoo's pivot answers one question at a time and forgets the answer. This app builds reports: tables that nest as deep as you like, run a second field across the top, follow links from one record to the next, work columns out from other columns, highlight what matters, open the records behind any number - and that every reader can bend and keep as a variant of their own. This page is the complete manual.
Read top to bottom, it takes you from install to a designed, scheduled report without contacting support. What you get Nested, cross-tab reports on any model - up to five row levels and two column levels, dates by day, week, month, quarter or year. Links followed without SQL - group order lines by the country of the customer of their order (Order ▸ Customer ▸ Country), with every access rule still in force. Numbers that are right at every level - sums, true averages, lowest, highest, filled-in counts, distinct counts, record counts.
Computed columns with total(), parent(), row() and prev() - the column before, for growth month on month. Period comparison - the same numbers for the period before, or the same period a year earlier, and the change in percent, next to every column. Fixed conditions the designer sets and readers can neither see nor lift. Share links - the report for somebody without a login, computed with your access, until the date you choose.
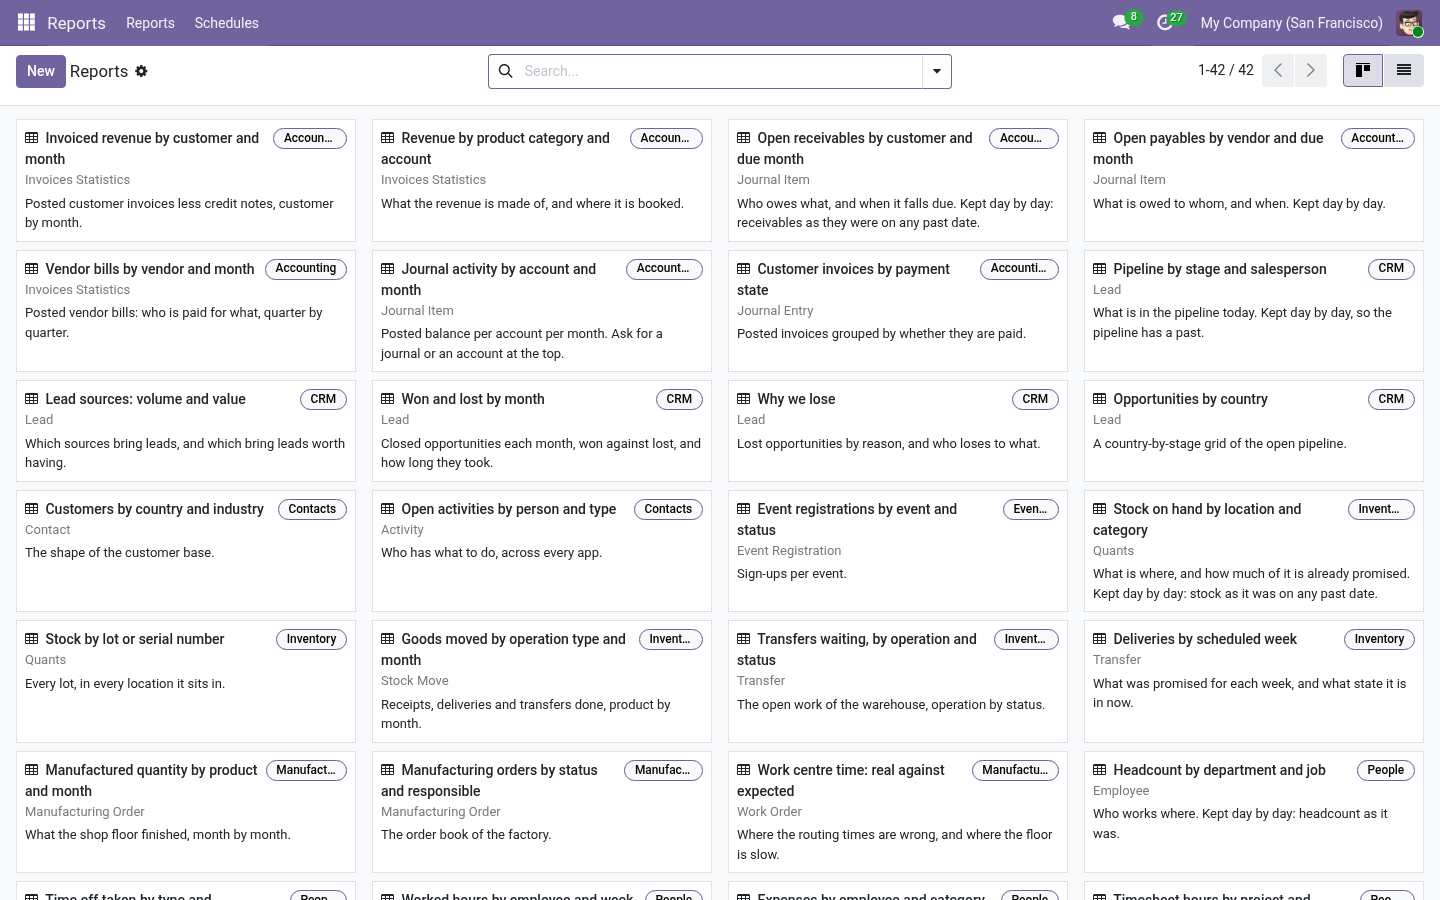
Highlights - rules and rank-based colour scales. The gallery. The list is not empty on the first day. Some forty reports are created for the apps you have installed - Sales, CRM, Accounting, Inventory, Purchase, Manufacturing, People, Project, Point of Sale - each one a working example you can open, bend and save under another name.
Install another app later and press Action ▸ Load the report gallery in the list view: the reports for the new app arrive, and nothing you already have is touched. A gallery report you do not want is archived, not deleted - a deleted one would come back with the next upgrade. Reading a report. Every reader counts only what their own access lets them read.
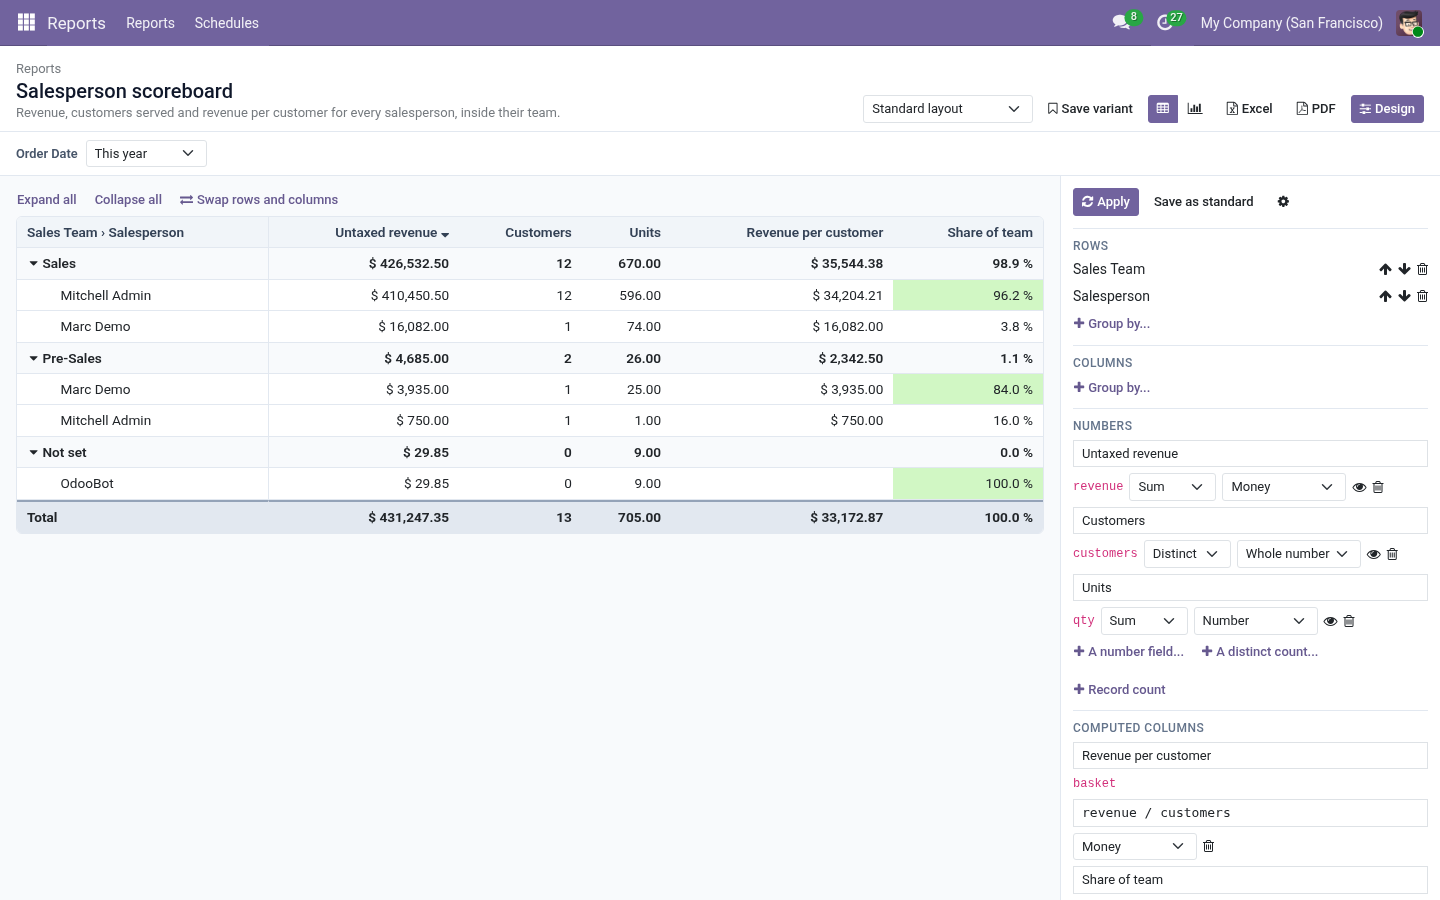
A salesperson who sees their own opportunities gets their own totals from the same report the sales manager opens. Fold and unfold a row with its arrow; Expand all and Collapse all are above the table. Click any number to open the records it counts - the cell's row, its column and every answer at the top of the screen are applied for you. Click a column heading to sort by it: largest first, smallest first, back to the labels.
Swap rows and columns turns the table on its side. The questions under the title (a period, a customer, a journal...) are the ones the designer chose to ask. A date question offers This month, Last quarter, Last 30 days and so on, or two dates of your own. Table / chart - the same definition as bars, lines or a pie: the first row level, one series per column.
Excel downloads what you see: your layout, your answers, the rows you folded left out. Nested rows arrive as Excel outline levels, so the workbook folds where the screen does, and the highlights come along. PDF prints the same table. Variants - your own way of looking, kept.
Change anything - the grouping, the period, the sort - and press Save variant. Give it a name; tick Share with everybody to offer it to your colleagues, and Open the report with it to make it your starting point. Variants are yours: nobody else can change or delete them, and saving under somebody else's shared variant makes a copy of your own. The report's standard layout, the one everybody starts from, is changed only by a Report Designer (Design ▸ Save as standard).
Designing a report. A Report Designer creates a report in three steps. 1. Reports ▸ New: a name, what it reads and, if not every record counts, a filter.
Pick the most detailed kind of record - order lines rather than orders - because a report can climb from a line to its order, the order's customer and the customer's country, but not down again. 2. Open Report, then Design. 3.
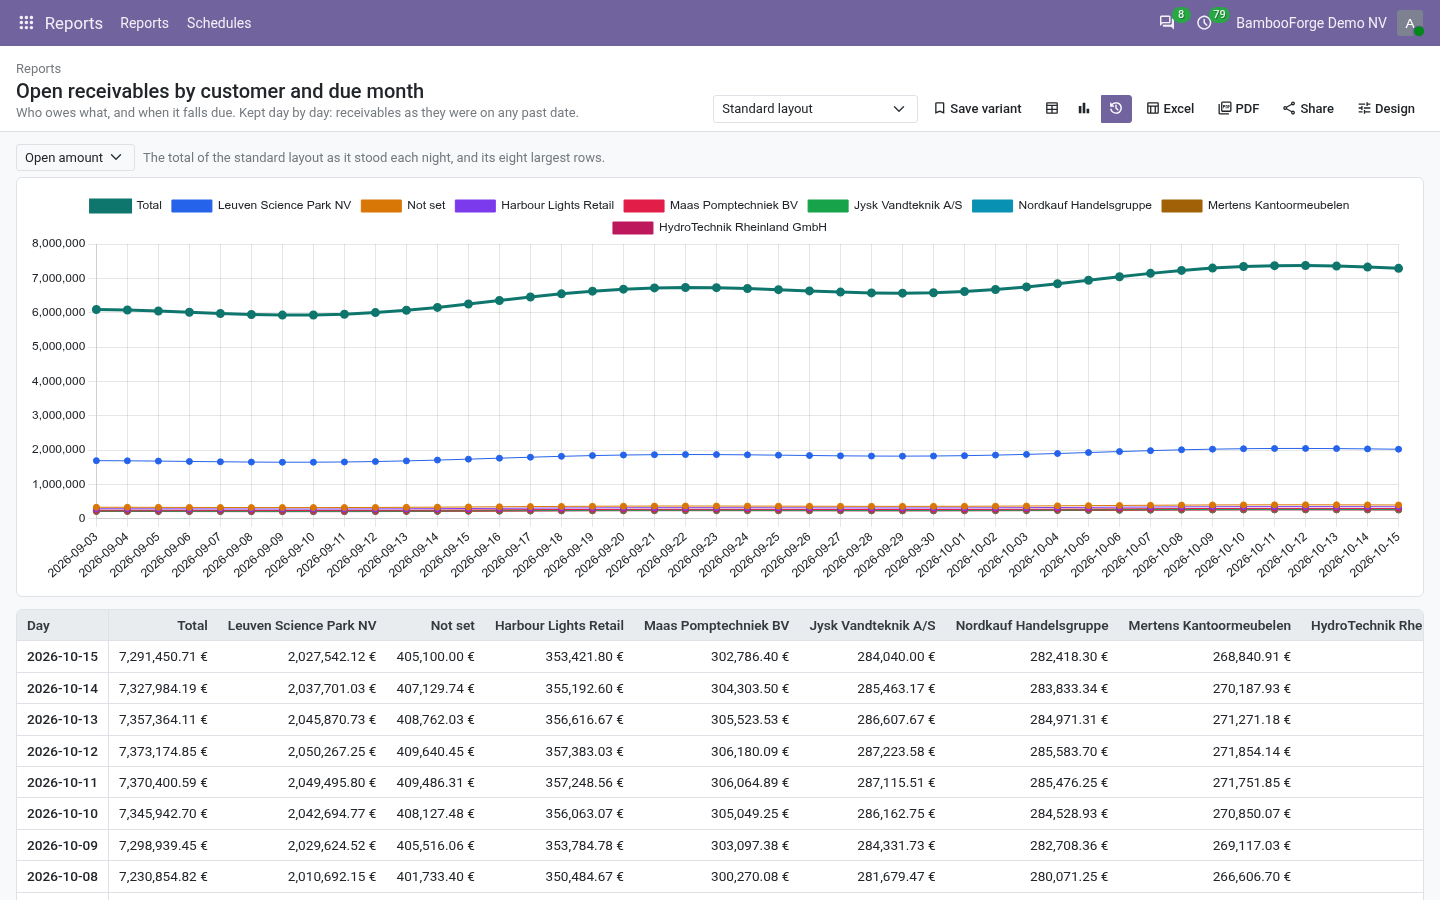
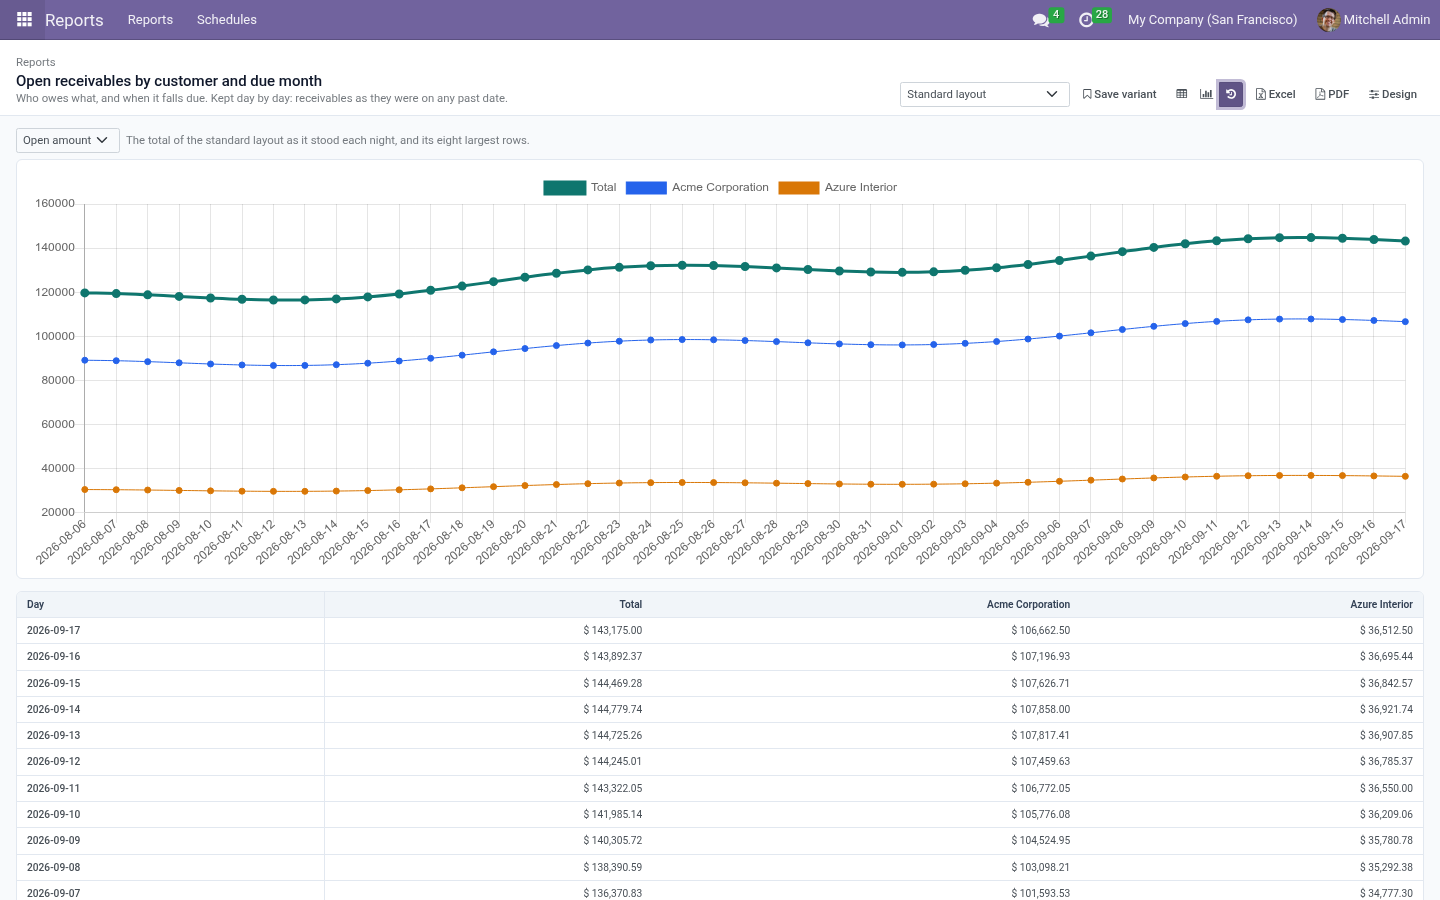
Build the layout in the panel on the right, press Apply to see it, and Save as standard when it is right. History - what the number was. Odoo knows what stock you hold and who owes you money today; it cannot tell you what either was on the first of last month. Tick Keep a Daily History on a report and every night its totals - the grand total and each first-level row - are written down, computed with the access of the user you name.
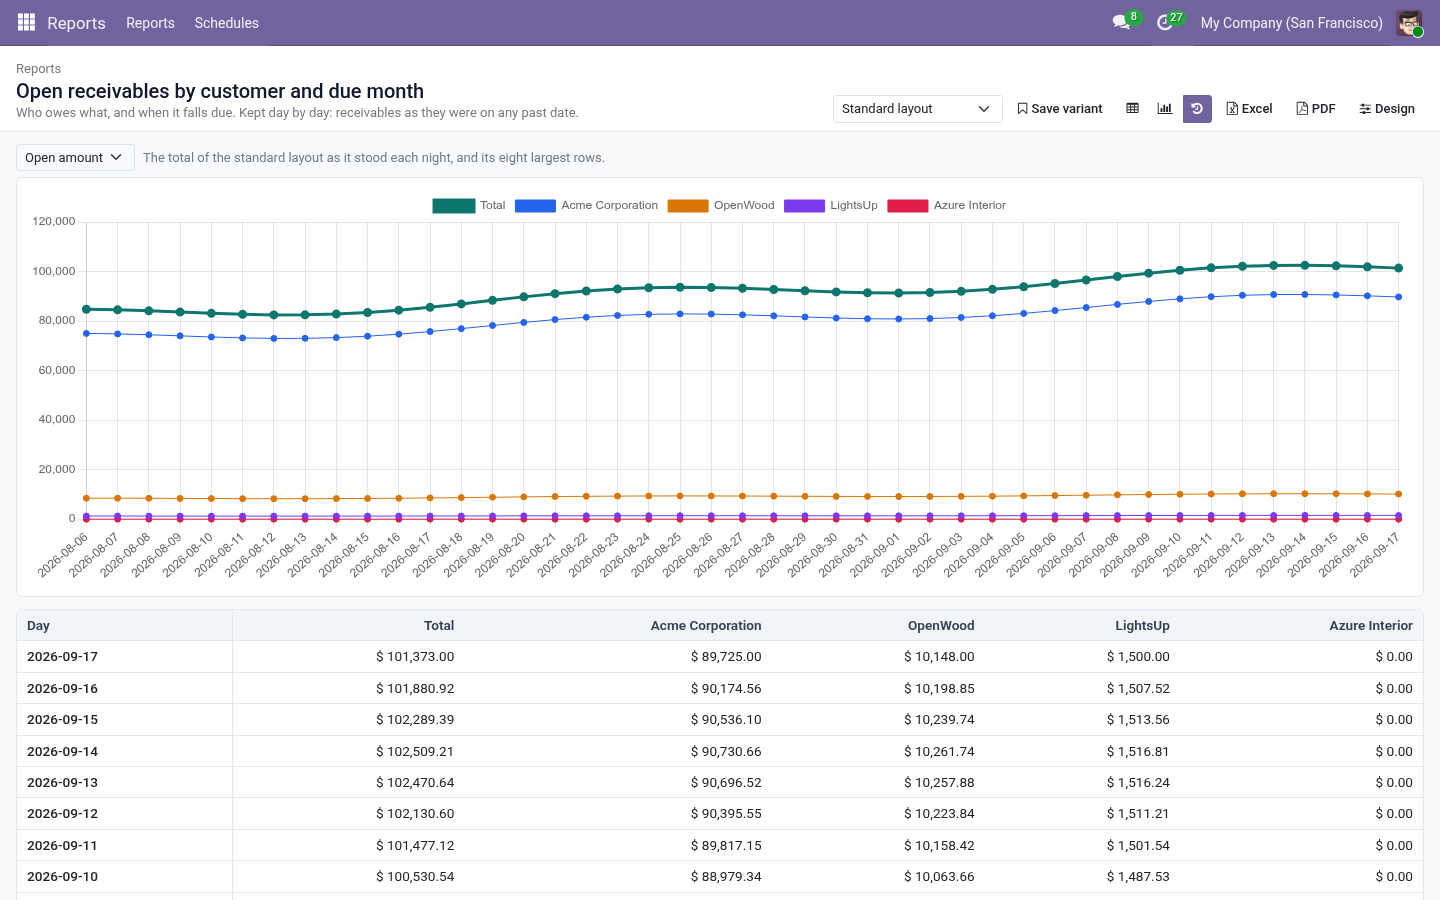
The clock button on the report then shows the total day by day, the eight largest rows beside it, as a chart and as a table. Several gallery reports keep a history out of the box: stock on hand, open receivables, open payables, the pipeline, delivered-not-invoiced, headcount. Write Today's History on the report form takes an entry at once. Reports by email.
Reports ▸ Schedules (Report Designers only). A schedule names reports, people and a rhythm: Send As: Excel workbook, PDF, or both. Each report goes out in its standard layout. Computed As: the reports are computed with this user's access, and the recipients receive what that user would see.
Choose somebody who may see everything the report counts, and recipients who may see it too. To Users, To Contacts, Other Addresses: anybody with an email address. Every day, every week on a weekday, or every month on a day from 1 to 28, not before an hour in the timezone you pick. An hourly scheduled action sends what is due.
A schedule sends once per period whatever happens - the day, week or month it last sent for is written on it - so a restarted server or a second cron run never doubles an email. Send Now ignores the rhythm. A report that cannot be computed is left out and noted in the schedule's chatter; the others still go. Troubleshooting.
"... is computed on the fly and cannot be grouped" The field is not stored in the database, so the database cannot group by it. Reach the same information through a stored link (for example Product ▸ Category instead of a computed Category shortcut). "A measure must be a stored field of ..." Numbers are added up by the database and must be stored fields of the model the report reads.
Read the more detailed model (lines, not documents), or one of Odoo's analysis models. Uninstalling. Uninstalling removes the reports, variants, schedules and histories this app created. It touches nothing else: no field is added to any of your models.
Now the part most videos leave out: what this does not do. A report is listed to the groups named under Visible To (everybody when empty). That decides who may open it. What it counts is decided by the reader's own access rights and record rules, every time: the same report gives a salesperson their own figures and the manager everybody's.
Nothing is computed with elevated rights except the nightly history and schedules, which run as the user you name on them. Variants are private to their owner unless shared; a shared variant is still changed and deleted by its owner alone. Computed columns accept arithmetic and six functions. They are parsed, not executed: there is no Python to inject.
The complete manual is at docs dot bambooforge dot dev, the demo database is linked from the store page, and support answers within twenty-four hours. Links are in the description.
Transcript of the walkthrough (Odoo 19)
Report Builder Pro with Pivot, Drill-down and Excel Export. Nested pivot and cross-tab reports on any model, without code: follow links between records, add computed columns, highlight what matters, click any number to open its records, keep your own variants, export to Excel and PDF, email on a schedule. 40 ready reports and a daily history of balances. Odoo's pivot answers one question at a time and forgets the answer.
This app builds reports: tables that nest as deep as you like, run a second field across the top, follow links from one record to the next, work columns out from other columns, highlight what matters, open the records behind any number - and that every reader can bend and keep as a variant of their own. In the next few minutes: report builder pro with pivot, drill-down and excel export, then what you get, then the gallery, then reading a report, then variants - your own way of looking, kept. Then what this app deliberately does not do, so you can tell before you buy whether it fits. Everything lives under Reports then Reports then Schedules.
Report Builder Pro with Pivot, Drill-down and Excel Export. Odoo's pivot answers one question at a time and forgets the answer. This app builds reports: tables that nest as deep as you like, run a second field across the top, follow links from one record to the next, work columns out from other columns, highlight what matters, open the records behind any number - and that every reader can bend and keep as a variant of their own. This page is the complete manual.
Read top to bottom, it takes you from install to a designed, scheduled report without contacting support. What you get Nested, cross-tab reports on any model - up to five row levels and two column levels, dates by day, week, month, quarter or year. Links followed without SQL - group order lines by the country of the customer of their order (Order ▸ Customer ▸ Country), with every access rule still in force. Numbers that are right at every level - sums, true averages, lowest, highest, filled-in counts, distinct counts, record counts.
Computed columns with total(), parent(), row() and prev() - the column before, for growth month on month. Period comparison - the same numbers for the period before, or the same period a year earlier, and the change in percent, next to every column. Fixed conditions the designer sets and readers can neither see nor lift. Share links - the report for somebody without a login, computed with your access, until the date you choose.
Highlights - rules and rank-based colour scales. The gallery. The list is not empty on the first day. Some forty reports are created for the apps you have installed - Sales, CRM, Accounting, Inventory, Purchase, Manufacturing, People, Project, Point of Sale - each one a working example you can open, bend and save under another name.
Install another app later and press Action ▸ Load the report gallery in the list view: the reports for the new app arrive, and nothing you already have is touched. A gallery report you do not want is archived, not deleted - a deleted one would come back with the next upgrade. Reading a report. Every reader counts only what their own access lets them read.
A salesperson who sees their own opportunities gets their own totals from the same report the sales manager opens. Fold and unfold a row with its arrow; Expand all and Collapse all are above the table. Click any number to open the records it counts - the cell's row, its column and every answer at the top of the screen are applied for you. Click a column heading to sort by it: largest first, smallest first, back to the labels.
Swap rows and columns turns the table on its side. The questions under the title (a period, a customer, a journal...) are the ones the designer chose to ask. A date question offers This month, Last quarter, Last 30 days and so on, or two dates of your own. Table / chart - the same definition as bars, lines or a pie: the first row level, one series per column.
Excel downloads what you see: your layout, your answers, the rows you folded left out. Nested rows arrive as Excel outline levels, so the workbook folds where the screen does, and the highlights come along. PDF prints the same table. Variants - your own way of looking, kept.
Change anything - the grouping, the period, the sort - and press Save variant. Give it a name; tick Share with everybody to offer it to your colleagues, and Open the report with it to make it your starting point. Variants are yours: nobody else can change or delete them, and saving under somebody else's shared variant makes a copy of your own. The report's standard layout, the one everybody starts from, is changed only by a Report Designer (Design ▸ Save as standard).
Designing a report. A Report Designer creates a report in three steps. 1. Reports ▸ New: a name, what it reads and, if not every record counts, a filter.
Pick the most detailed kind of record - order lines rather than orders - because a report can climb from a line to its order, the order's customer and the customer's country, but not down again. 2. Open Report, then Design. 3.
Build the layout in the panel on the right, press Apply to see it, and Save as standard when it is right. History - what the number was. Odoo knows what stock you hold and who owes you money today; it cannot tell you what either was on the first of last month. Tick Keep a Daily History on a report and every night its totals - the grand total and each first-level row - are written down, computed with the access of the user you name.
The clock button on the report then shows the total day by day, the eight largest rows beside it, as a chart and as a table. Several gallery reports keep a history out of the box: stock on hand, open receivables, open payables, the pipeline, delivered-not-invoiced, headcount. Write Today's History on the report form takes an entry at once. Reports by email.
Reports ▸ Schedules (Report Designers only). A schedule names reports, people and a rhythm: Send As: Excel workbook, PDF, or both. Each report goes out in its standard layout. Computed As: the reports are computed with this user's access, and the recipients receive what that user would see.
Choose somebody who may see everything the report counts, and recipients who may see it too. To Users, To Contacts, Other Addresses: anybody with an email address. Every day, every week on a weekday, or every month on a day from 1 to 28, not before an hour in the timezone you pick. An hourly scheduled action sends what is due.
A schedule sends once per period whatever happens - the day, week or month it last sent for is written on it - so a restarted server or a second cron run never doubles an email. Send Now ignores the rhythm. A report that cannot be computed is left out and noted in the schedule's chatter; the others still go. Troubleshooting.
"... is computed on the fly and cannot be grouped" The field is not stored in the database, so the database cannot group by it. Reach the same information through a stored link (for example Product ▸ Category instead of a computed Category shortcut). "A measure must be a stored field of ..." Numbers are added up by the database and must be stored fields of the model the report reads.
Read the more detailed model (lines, not documents), or one of Odoo's analysis models. Uninstalling. Uninstalling removes the reports, variants, schedules and histories this app created. It touches nothing else: no field is added to any of your models.
Now the part most videos leave out: what this does not do. A report is listed to the groups named under Visible To (everybody when empty). That decides who may open it. What it counts is decided by the reader's own access rights and record rules, every time: the same report gives a salesperson their own figures and the manager everybody's.
Nothing is computed with elevated rights except the nightly history and schedules, which run as the user you name on them. Variants are private to their owner unless shared; a shared variant is still changed and deleted by its owner alone. Computed columns accept arithmetic and six functions. They are parsed, not executed: there is no Python to inject.
The complete manual is at docs dot bambooforge dot dev, the demo database is linked from the store page, and support answers within twenty-four hours. Links are in the description.
Transcript of the walkthrough (Odoo 18)
Report Builder Pro with Pivot, Drill-down and Excel Export. Nested pivot and cross-tab reports on any model, without code: follow links between records, add computed columns, highlight what matters, click any number to open its records, keep your own variants, export to Excel and PDF, email on a schedule. 40 ready reports and a daily history of balances. Odoo's pivot answers one question at a time and forgets the answer.
This app builds reports: tables that nest as deep as you like, run a second field across the top, follow links from one record to the next, work columns out from other columns, highlight what matters, open the records behind any number - and that every reader can bend and keep as a variant of their own. In the next few minutes: report builder pro with pivot, drill-down and excel export, then what you get, then the gallery, then reading a report, then variants - your own way of looking, kept. Then what this app deliberately does not do, so you can tell before you buy whether it fits. Everything lives under Reports then Reports then Schedules.
Report Builder Pro with Pivot, Drill-down and Excel Export. Odoo's pivot answers one question at a time and forgets the answer. This app builds reports: tables that nest as deep as you like, run a second field across the top, follow links from one record to the next, work columns out from other columns, highlight what matters, open the records behind any number - and that every reader can bend and keep as a variant of their own. This page is the complete manual.
Read top to bottom, it takes you from install to a designed, scheduled report without contacting support. What you get Nested, cross-tab reports on any model - up to five row levels and two column levels, dates by day, week, month, quarter or year. Links followed without SQL - group order lines by the country of the customer of their order (Order ▸ Customer ▸ Country), with every access rule still in force. Numbers that are right at every level - sums, true averages, lowest, highest, filled-in counts, distinct counts, record counts.
Computed columns with total(), parent(), row() and prev() - the column before, for growth month on month. Period comparison - the same numbers for the period before, or the same period a year earlier, and the change in percent, next to every column. Fixed conditions the designer sets and readers can neither see nor lift. Share links - the report for somebody without a login, computed with your access, until the date you choose.
Highlights - rules and rank-based colour scales. The gallery. The list is not empty on the first day. Some forty reports are created for the apps you have installed - Sales, CRM, Accounting, Inventory, Purchase, Manufacturing, People, Project, Point of Sale - each one a working example you can open, bend and save under another name.
Install another app later and press Action ▸ Load the report gallery in the list view: the reports for the new app arrive, and nothing you already have is touched. A gallery report you do not want is archived, not deleted - a deleted one would come back with the next upgrade. Reading a report. Every reader counts only what their own access lets them read.
A salesperson who sees their own opportunities gets their own totals from the same report the sales manager opens. Fold and unfold a row with its arrow; Expand all and Collapse all are above the table. Click any number to open the records it counts - the cell's row, its column and every answer at the top of the screen are applied for you. Click a column heading to sort by it: largest first, smallest first, back to the labels.
Swap rows and columns turns the table on its side. The questions under the title (a period, a customer, a journal...) are the ones the designer chose to ask. A date question offers This month, Last quarter, Last 30 days and so on, or two dates of your own. Table / chart - the same definition as bars, lines or a pie: the first row level, one series per column.
Excel downloads what you see: your layout, your answers, the rows you folded left out. Nested rows arrive as Excel outline levels, so the workbook folds where the screen does, and the highlights come along. PDF prints the same table. Variants - your own way of looking, kept.
Change anything - the grouping, the period, the sort - and press Save variant. Give it a name; tick Share with everybody to offer it to your colleagues, and Open the report with it to make it your starting point. Variants are yours: nobody else can change or delete them, and saving under somebody else's shared variant makes a copy of your own. The report's standard layout, the one everybody starts from, is changed only by a Report Designer (Design ▸ Save as standard).
Designing a report. A Report Designer creates a report in three steps. 1. Reports ▸ New: a name, what it reads and, if not every record counts, a filter.
Pick the most detailed kind of record - order lines rather than orders - because a report can climb from a line to its order, the order's customer and the customer's country, but not down again. 2. Open Report, then Design. 3.
Build the layout in the panel on the right, press Apply to see it, and Save as standard when it is right. History - what the number was. Odoo knows what stock you hold and who owes you money today; it cannot tell you what either was on the first of last month. Tick Keep a Daily History on a report and every night its totals - the grand total and each first-level row - are written down, computed with the access of the user you name.
The clock button on the report then shows the total day by day, the eight largest rows beside it, as a chart and as a table. Several gallery reports keep a history out of the box: stock on hand, open receivables, open payables, the pipeline, delivered-not-invoiced, headcount. Write Today's History on the report form takes an entry at once. Reports by email.
Reports ▸ Schedules (Report Designers only). A schedule names reports, people and a rhythm: Send As: Excel workbook, PDF, or both. Each report goes out in its standard layout. Computed As: the reports are computed with this user's access, and the recipients receive what that user would see.
Choose somebody who may see everything the report counts, and recipients who may see it too. To Users, To Contacts, Other Addresses: anybody with an email address. Every day, every week on a weekday, or every month on a day from 1 to 28, not before an hour in the timezone you pick. An hourly scheduled action sends what is due.
A schedule sends once per period whatever happens - the day, week or month it last sent for is written on it - so a restarted server or a second cron run never doubles an email. Send Now ignores the rhythm. A report that cannot be computed is left out and noted in the schedule's chatter; the others still go. Troubleshooting.
"... is computed on the fly and cannot be grouped" The field is not stored in the database, so the database cannot group by it. Reach the same information through a stored link (for example Product ▸ Category instead of a computed Category shortcut). "A measure must be a stored field of ..." Numbers are added up by the database and must be stored fields of the model the report reads.
Read the more detailed model (lines, not documents), or one of Odoo's analysis models. Uninstalling. Uninstalling removes the reports, variants, schedules and histories this app created. It touches nothing else: no field is added to any of your models.
Now the part most videos leave out: what this does not do. A report is listed to the groups named under Visible To (everybody when empty). That decides who may open it. What it counts is decided by the reader's own access rights and record rules, every time: the same report gives a salesperson their own figures and the manager everybody's.
Nothing is computed with elevated rights except the nightly history and schedules, which run as the user you name on them. Variants are private to their owner unless shared; a shared variant is still changed and deleted by its owner alone. Computed columns accept arithmetic and six functions. They are parsed, not executed: there is no Python to inject.
The complete manual is at docs dot bambooforge dot dev, the demo database is linked from the store page, and support answers within twenty-four hours. Links are in the description.
Transcript of the walkthrough (Odoo 17)
Report Builder Pro with Pivot, Drill-down and Excel Export. Nested pivot and cross-tab reports on any model, without code: follow links between records, add computed columns, highlight what matters, click any number to open its records, keep your own variants, export to Excel and PDF, email on a schedule. 40 ready reports and a daily history of balances. Odoo's pivot answers one question at a time and forgets the answer.
This app builds reports: tables that nest as deep as you like, run a second field across the top, follow links from one record to the next, work columns out from other columns, highlight what matters, open the records behind any number - and that every reader can bend and keep as a variant of their own. In the next few minutes: report builder pro with pivot, drill-down and excel export, then what you get, then the gallery, then reading a report, then variants - your own way of looking, kept. Then what this app deliberately does not do, so you can tell before you buy whether it fits. Everything lives under Reports then Reports then Schedules.
Report Builder Pro with Pivot, Drill-down and Excel Export. Odoo's pivot answers one question at a time and forgets the answer. This app builds reports: tables that nest as deep as you like, run a second field across the top, follow links from one record to the next, work columns out from other columns, highlight what matters, open the records behind any number - and that every reader can bend and keep as a variant of their own. This page is the complete manual.
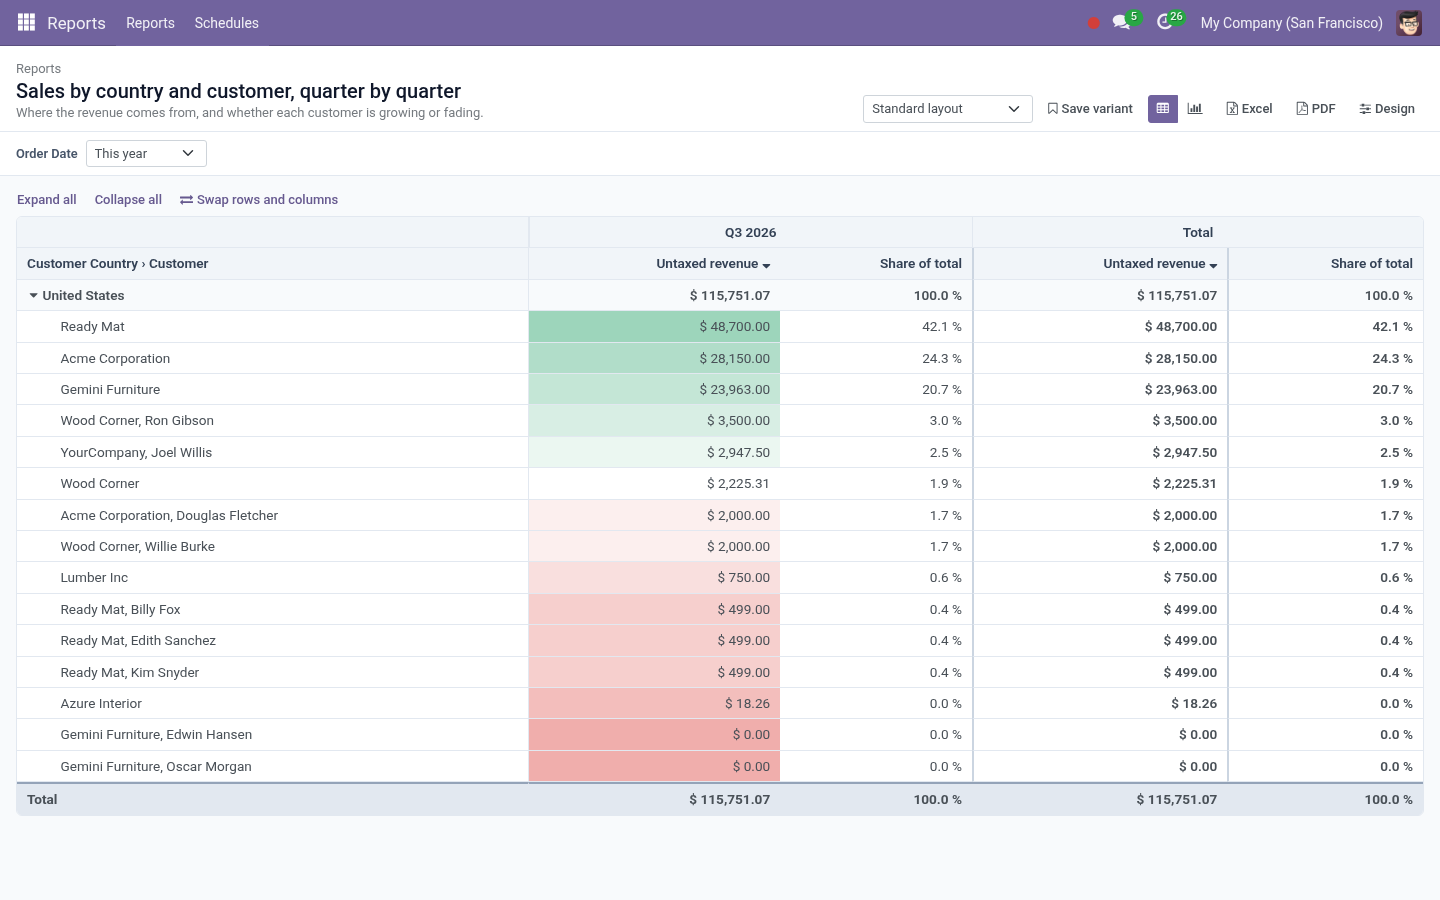
Read top to bottom, it takes you from install to a designed, scheduled report without contacting support. What you get Nested, cross-tab reports on any model - up to five row levels and two column levels, dates by day, week, month, quarter or year. Links followed without SQL - group order lines by the country of the customer of their order (Order ▸ Customer ▸ Country), with every access rule still in force. Numbers that are right at every level - sums, true averages, lowest, highest, filled-in counts, distinct counts, record counts.
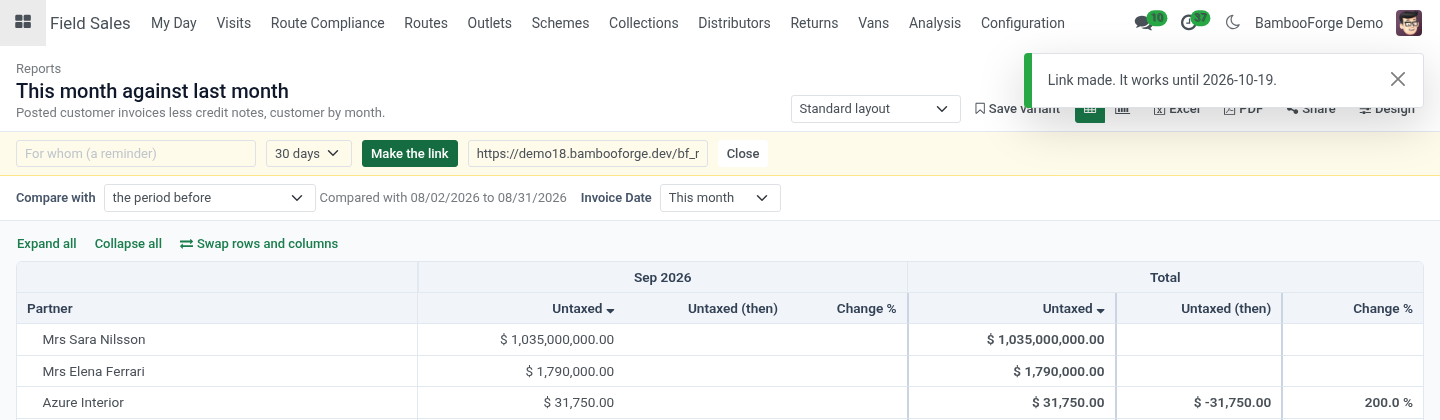
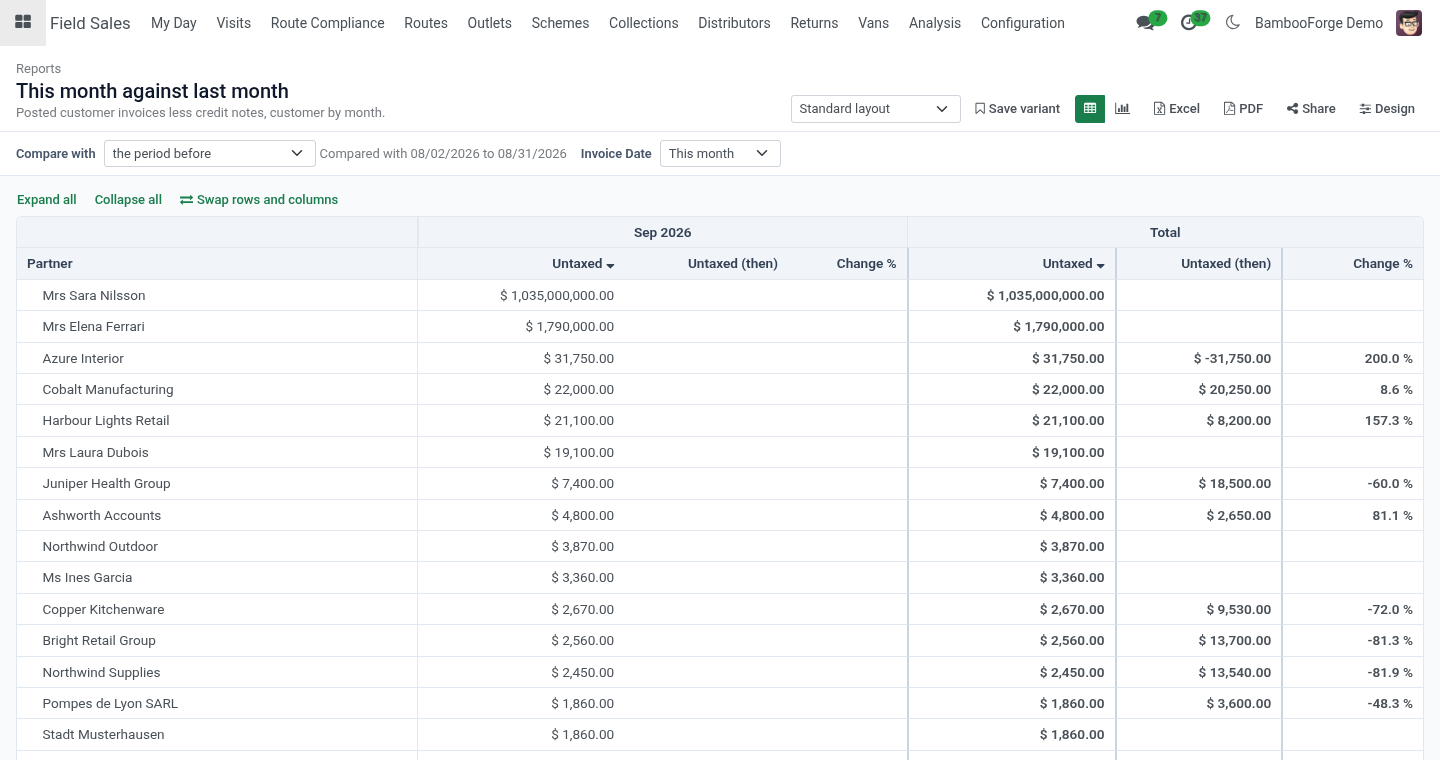
Computed columns with total(), parent(), row() and prev() - the column before, for growth month on month. Period comparison - the same numbers for the period before, or the same period a year earlier, and the change in percent, next to every column. Fixed conditions the designer sets and readers can neither see nor lift. Share links - the report for somebody without a login, computed with your access, until the date you choose.
Highlights - rules and rank-based colour scales. The gallery. The list is not empty on the first day. Some forty reports are created for the apps you have installed - Sales, CRM, Accounting, Inventory, Purchase, Manufacturing, People, Project, Point of Sale - each one a working example you can open, bend and save under another name.
Install another app later and press Action ▸ Load the report gallery in the list view: the reports for the new app arrive, and nothing you already have is touched. A gallery report you do not want is archived, not deleted - a deleted one would come back with the next upgrade. Reading a report. Every reader counts only what their own access lets them read.
A salesperson who sees their own opportunities gets their own totals from the same report the sales manager opens. Fold and unfold a row with its arrow; Expand all and Collapse all are above the table. Click any number to open the records it counts - the cell's row, its column and every answer at the top of the screen are applied for you. Click a column heading to sort by it: largest first, smallest first, back to the labels.
Swap rows and columns turns the table on its side. The questions under the title (a period, a customer, a journal...) are the ones the designer chose to ask. A date question offers This month, Last quarter, Last 30 days and so on, or two dates of your own. Table / chart - the same definition as bars, lines or a pie: the first row level, one series per column.
Excel downloads what you see: your layout, your answers, the rows you folded left out. Nested rows arrive as Excel outline levels, so the workbook folds where the screen does, and the highlights come along. PDF prints the same table. Variants - your own way of looking, kept.
Change anything - the grouping, the period, the sort - and press Save variant. Give it a name; tick Share with everybody to offer it to your colleagues, and Open the report with it to make it your starting point. Variants are yours: nobody else can change or delete them, and saving under somebody else's shared variant makes a copy of your own. The report's standard layout, the one everybody starts from, is changed only by a Report Designer (Design ▸ Save as standard).
Designing a report. A Report Designer creates a report in three steps. 1. Reports ▸ New: a name, what it reads and, if not every record counts, a filter.
Pick the most detailed kind of record - order lines rather than orders - because a report can climb from a line to its order, the order's customer and the customer's country, but not down again. 2. Open Report, then Design. 3.
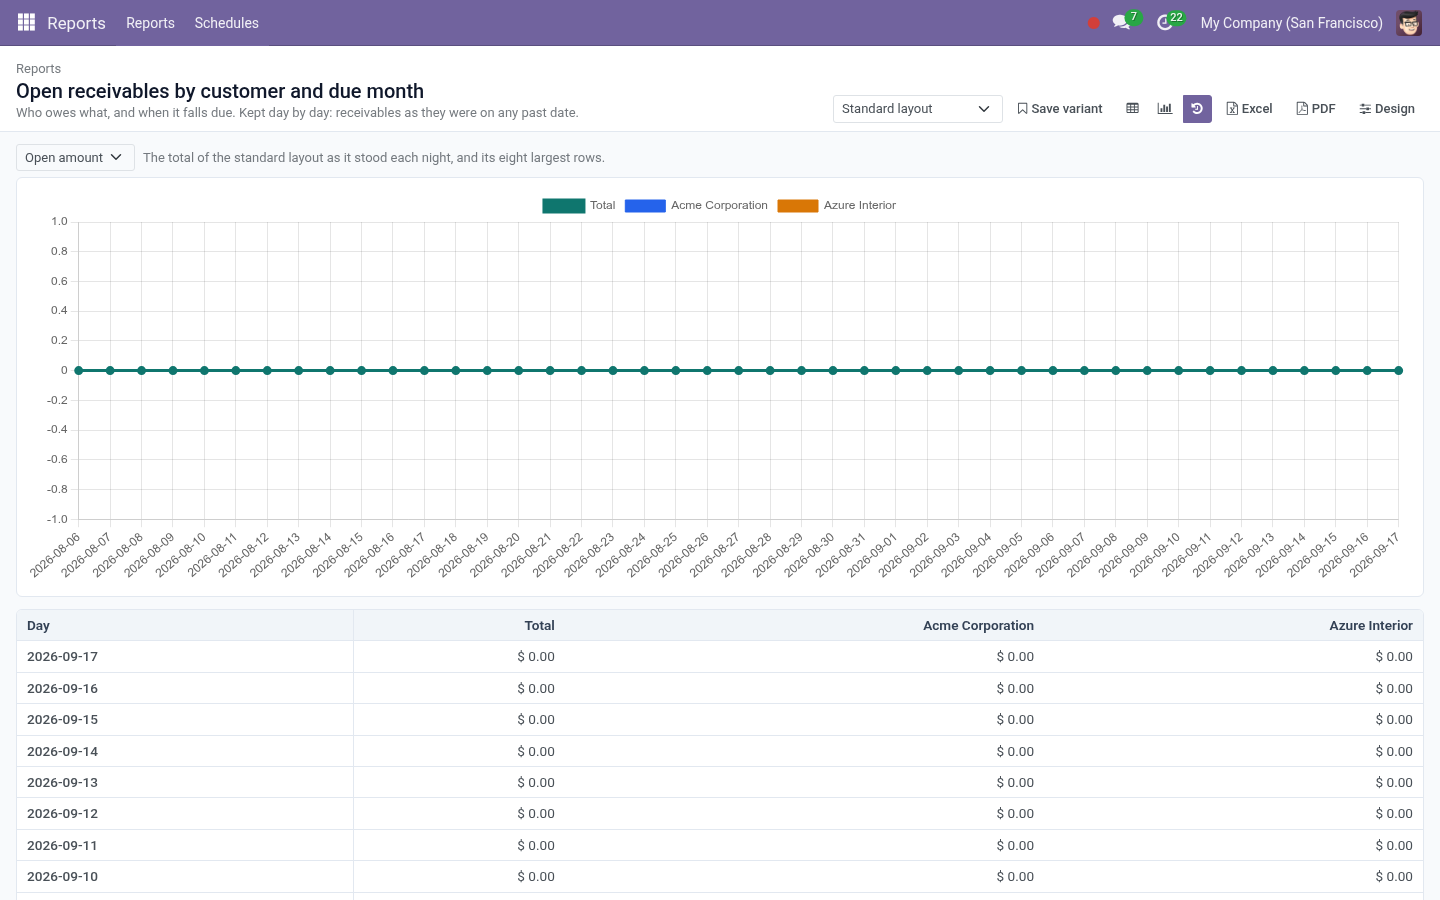
Build the layout in the panel on the right, press Apply to see it, and Save as standard when it is right. History - what the number was. Odoo knows what stock you hold and who owes you money today; it cannot tell you what either was on the first of last month. Tick Keep a Daily History on a report and every night its totals - the grand total and each first-level row - are written down, computed with the access of the user you name.
The clock button on the report then shows the total day by day, the eight largest rows beside it, as a chart and as a table. Several gallery reports keep a history out of the box: stock on hand, open receivables, open payables, the pipeline, delivered-not-invoiced, headcount. Write Today's History on the report form takes an entry at once. Reports by email.
Reports ▸ Schedules (Report Designers only). A schedule names reports, people and a rhythm: Send As: Excel workbook, PDF, or both. Each report goes out in its standard layout. Computed As: the reports are computed with this user's access, and the recipients receive what that user would see.
Choose somebody who may see everything the report counts, and recipients who may see it too. To Users, To Contacts, Other Addresses: anybody with an email address. Every day, every week on a weekday, or every month on a day from 1 to 28, not before an hour in the timezone you pick. An hourly scheduled action sends what is due.
A schedule sends once per period whatever happens - the day, week or month it last sent for is written on it - so a restarted server or a second cron run never doubles an email. Send Now ignores the rhythm. A report that cannot be computed is left out and noted in the schedule's chatter; the others still go. Troubleshooting.
"... is computed on the fly and cannot be grouped" The field is not stored in the database, so the database cannot group by it. Reach the same information through a stored link (for example Product ▸ Category instead of a computed Category shortcut). "A measure must be a stored field of ..." Numbers are added up by the database and must be stored fields of the model the report reads.
Read the more detailed model (lines, not documents), or one of Odoo's analysis models. Uninstalling. Uninstalling removes the reports, variants, schedules and histories this app created. It touches nothing else: no field is added to any of your models.
Now the part most videos leave out: what this does not do. A report is listed to the groups named under Visible To (everybody when empty). That decides who may open it. What it counts is decided by the reader's own access rights and record rules, every time: the same report gives a salesperson their own figures and the manager everybody's.
Nothing is computed with elevated rights except the nightly history and schedules, which run as the user you name on them. Variants are private to their owner unless shared; a shared variant is still changed and deleted by its owner alone. Computed columns accept arithmetic and six functions. They are parsed, not executed: there is no Python to inject.
The complete manual is at docs dot bambooforge dot dev, the demo database is linked from the store page, and support answers within twenty-four hours. Links are in the description.
Transcript of the walkthrough (Odoo 16)
Report Builder Pro with Pivot, Drill-down and Excel Export. Nested pivot and cross-tab reports on any model, without code: follow links between records, add computed columns, highlight what matters, click any number to open its records, keep your own variants, export to Excel and PDF, email on a schedule. 40 ready reports and a daily history of balances. Odoo's pivot answers one question at a time and forgets the answer.
This app builds reports: tables that nest as deep as you like, run a second field across the top, follow links from one record to the next, work columns out from other columns, highlight what matters, open the records behind any number - and that every reader can bend and keep as a variant of their own. In the next few minutes: report builder pro with pivot, drill-down and excel export, then what you get, then the gallery, then reading a report, then variants - your own way of looking, kept. Then what this app deliberately does not do, so you can tell before you buy whether it fits. Everything lives under Reports then Reports then Schedules.
Report Builder Pro with Pivot, Drill-down and Excel Export. Odoo's pivot answers one question at a time and forgets the answer. This app builds reports: tables that nest as deep as you like, run a second field across the top, follow links from one record to the next, work columns out from other columns, highlight what matters, open the records behind any number - and that every reader can bend and keep as a variant of their own. This page is the complete manual.
Read top to bottom, it takes you from install to a designed, scheduled report without contacting support. What you get Nested, cross-tab reports on any model - up to five row levels and two column levels, dates by day, week, month, quarter or year. Links followed without SQL - group order lines by the country of the customer of their order (Order ▸ Customer ▸ Country), with every access rule still in force. Numbers that are right at every level - sums, true averages, lowest, highest, filled-in counts, distinct counts, record counts.
Computed columns with total(), parent(), row() and prev() - the column before, for growth month on month. Period comparison - the same numbers for the period before, or the same period a year earlier, and the change in percent, next to every column. Fixed conditions the designer sets and readers can neither see nor lift. Share links - the report for somebody without a login, computed with your access, until the date you choose.
Highlights - rules and rank-based colour scales. The gallery. The list is not empty on the first day. Some forty reports are created for the apps you have installed - Sales, CRM, Accounting, Inventory, Purchase, Manufacturing, People, Project, Point of Sale - each one a working example you can open, bend and save under another name.
Install another app later and press Action ▸ Load the report gallery in the list view: the reports for the new app arrive, and nothing you already have is touched. A gallery report you do not want is archived, not deleted - a deleted one would come back with the next upgrade. Reading a report. Every reader counts only what their own access lets them read.
A salesperson who sees their own opportunities gets their own totals from the same report the sales manager opens. Fold and unfold a row with its arrow; Expand all and Collapse all are above the table. Click any number to open the records it counts - the cell's row, its column and every answer at the top of the screen are applied for you. Click a column heading to sort by it: largest first, smallest first, back to the labels.
Swap rows and columns turns the table on its side. The questions under the title (a period, a customer, a journal...) are the ones the designer chose to ask. A date question offers This month, Last quarter, Last 30 days and so on, or two dates of your own. Table / chart - the same definition as bars, lines or a pie: the first row level, one series per column.
Excel downloads what you see: your layout, your answers, the rows you folded left out. Nested rows arrive as Excel outline levels, so the workbook folds where the screen does, and the highlights come along. PDF prints the same table. Variants - your own way of looking, kept.
Change anything - the grouping, the period, the sort - and press Save variant. Give it a name; tick Share with everybody to offer it to your colleagues, and Open the report with it to make it your starting point. Variants are yours: nobody else can change or delete them, and saving under somebody else's shared variant makes a copy of your own. The report's standard layout, the one everybody starts from, is changed only by a Report Designer (Design ▸ Save as standard).
Designing a report. A Report Designer creates a report in three steps. 1. Reports ▸ New: a name, what it reads and, if not every record counts, a filter.
Pick the most detailed kind of record - order lines rather than orders - because a report can climb from a line to its order, the order's customer and the customer's country, but not down again. 2. Open Report, then Design. 3.
Build the layout in the panel on the right, press Apply to see it, and Save as standard when it is right. History - what the number was. Odoo knows what stock you hold and who owes you money today; it cannot tell you what either was on the first of last month. Tick Keep a Daily History on a report and every night its totals - the grand total and each first-level row - are written down, computed with the access of the user you name.
The clock button on the report then shows the total day by day, the eight largest rows beside it, as a chart and as a table. Several gallery reports keep a history out of the box: stock on hand, open receivables, open payables, the pipeline, delivered-not-invoiced, headcount. Write Today's History on the report form takes an entry at once. Reports by email.
Reports ▸ Schedules (Report Designers only). A schedule names reports, people and a rhythm: Send As: Excel workbook, PDF, or both. Each report goes out in its standard layout. Computed As: the reports are computed with this user's access, and the recipients receive what that user would see.
Choose somebody who may see everything the report counts, and recipients who may see it too. To Users, To Contacts, Other Addresses: anybody with an email address. Every day, every week on a weekday, or every month on a day from 1 to 28, not before an hour in the timezone you pick. An hourly scheduled action sends what is due.
A schedule sends once per period whatever happens - the day, week or month it last sent for is written on it - so a restarted server or a second cron run never doubles an email. Send Now ignores the rhythm. A report that cannot be computed is left out and noted in the schedule's chatter; the others still go. Troubleshooting.
"... is computed on the fly and cannot be grouped" The field is not stored in the database, so the database cannot group by it. Reach the same information through a stored link (for example Product ▸ Category instead of a computed Category shortcut). "A measure must be a stored field of ..." Numbers are added up by the database and must be stored fields of the model the report reads.
Read the more detailed model (lines, not documents), or one of Odoo's analysis models. Uninstalling. Uninstalling removes the reports, variants, schedules and histories this app created. It touches nothing else: no field is added to any of your models.
Now the part most videos leave out: what this does not do. A report is listed to the groups named under Visible To (everybody when empty). That decides who may open it. What it counts is decided by the reader's own access rights and record rules, every time: the same report gives a salesperson their own figures and the manager everybody's.
Nothing is computed with elevated rights except the nightly history and schedules, which run as the user you name on them. Variants are private to their owner unless shared; a shared variant is still changed and deleted by its owner alone. Computed columns accept arithmetic and six functions. They are parsed, not executed: there is no Python to inject.
The complete manual is at docs dot bambooforge dot dev, the demo database is linked from the store page, and support answers within twenty-four hours. Links are in the description.
Key facts
- What it is
- Nested pivot and cross-tab reports on any model, without code: follow links between records, add computed columns, highlight what matters, click any number to open its records, keep your own variants, export to Excel and PDF, email on a schedule. 40 ready reports and a daily history of balances.
- For
- Productivity
- Odoo versions
- 16.0, 17.0, 18.0, 19.0, 20.0 - Community and Enterprise
- Runs on
- Odoo.sh or Odoo you host yourself - not Odoo Online, which accepts no third-party apps
- Price
- 129 EUR, one-time, on the Odoo Apps Store
- Technical name
- bambooforge_report_builder
- Not for
- A report reads one model and whatever it reaches through many2one links. It does not join two unrelated models.; Numbers must be stored fields of the model itself. A computed, non-stored field cannot be summed by the database.; Amounts are added as stored. For money across currencies, read the analysis models - Sales Analysis, Invoices Statistics, Purchase Report - as the gallery does: they hold company-currency amounts.; A layout that produces more than 20,000 combinations is cut, and says so.; Reports are not placed on Odoo's own spreadsheets. With BambooForge Dashboard installed (Odoo 17 and later), the small Report Builder on Dashboards module installs by itself and a dashboard tile or KPI can show a report's grand total.; A share link shows what its creator can see; a link to a report of salaries is a link to salaries. Share what you would print.; The chart draws the first row level only.
- Compared with the alternatives
- https://docs.bambooforge.dev/bambooforge_report_builder/compare/
- Manual last updated
- 2026-10-15
Report Builder Pro with Pivot, Drill-down and Excel Export
Odoo's pivot answers one question at a time and forgets the answer. This app builds reports: tables that nest as deep as you like, run a second field across the top, follow links from one record to the next, work columns out from other columns, highlight what matters, open the records behind any number - and that every reader can bend and keep as a variant of their own.
This page is the complete manual. Read top to bottom, it takes you from install to a designed, scheduled report without contacting support.
What you get
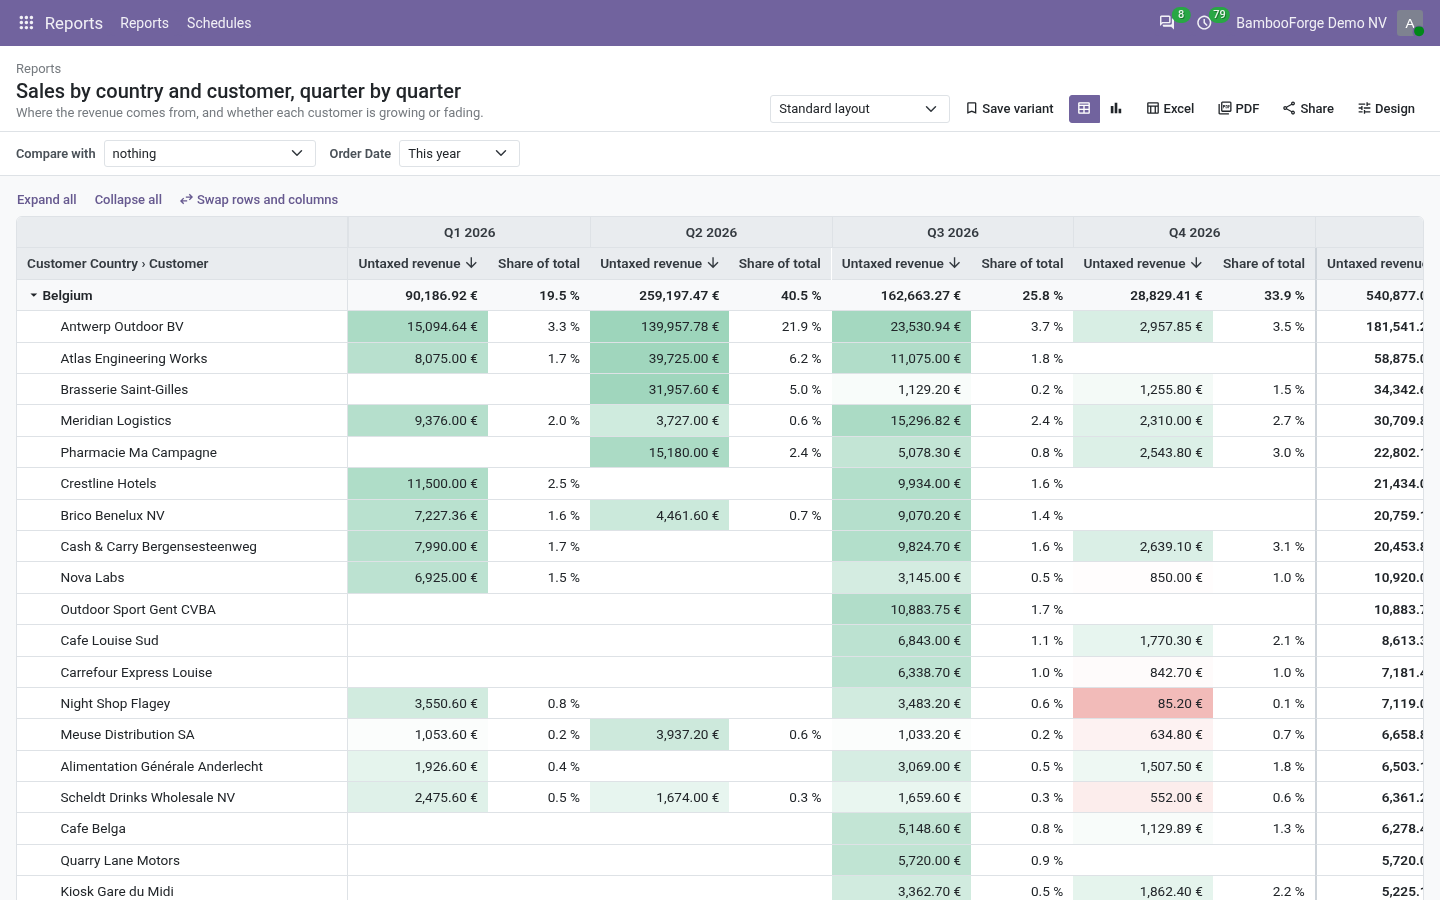
Nested, cross-tab reports on any model - up to five row levels and two column levels, dates by day, week, month, quarter or year.
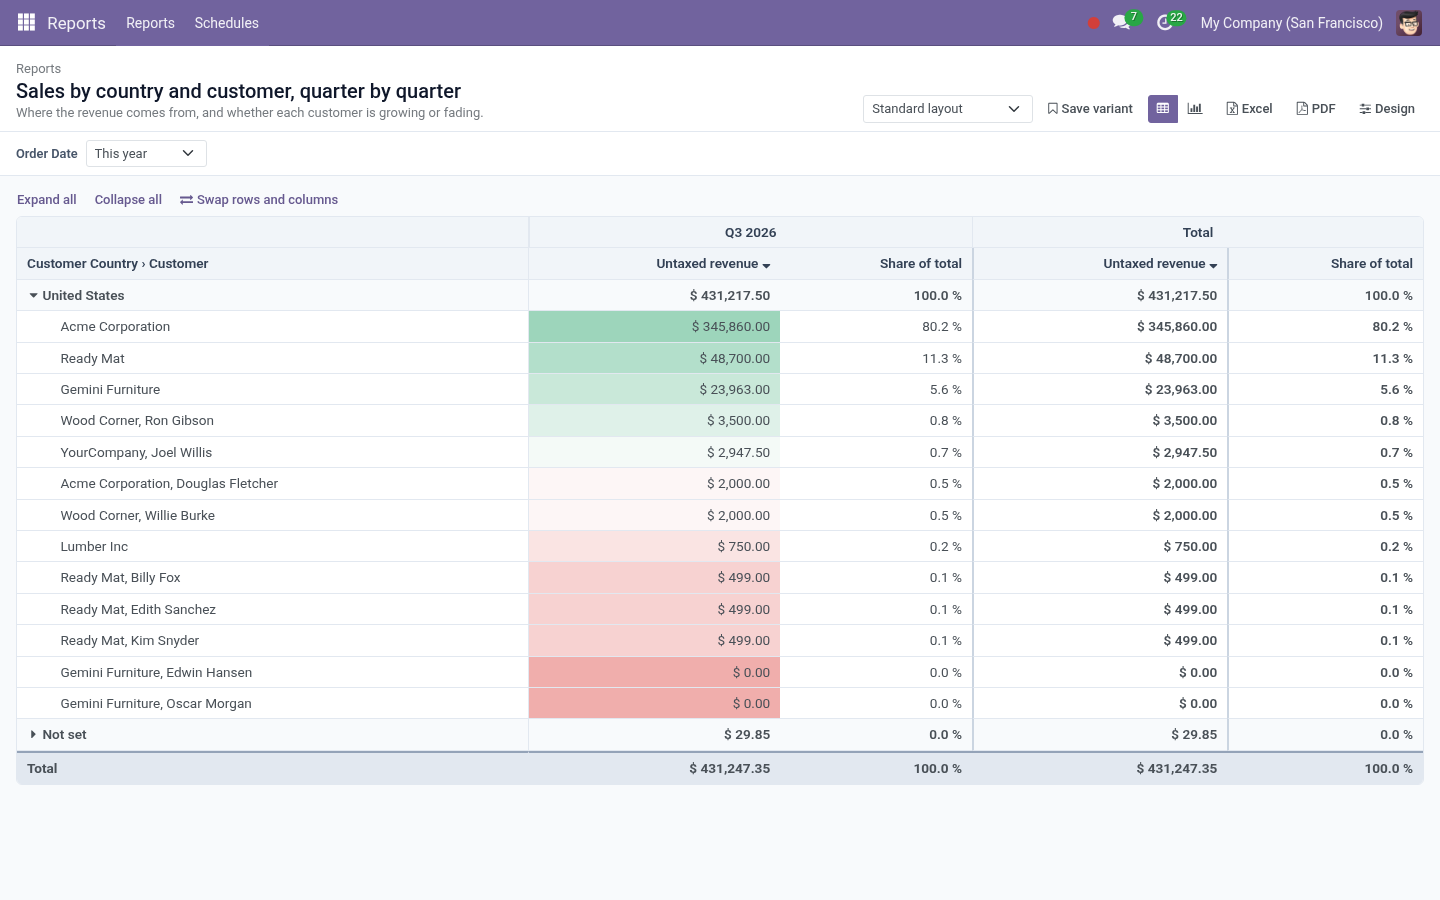
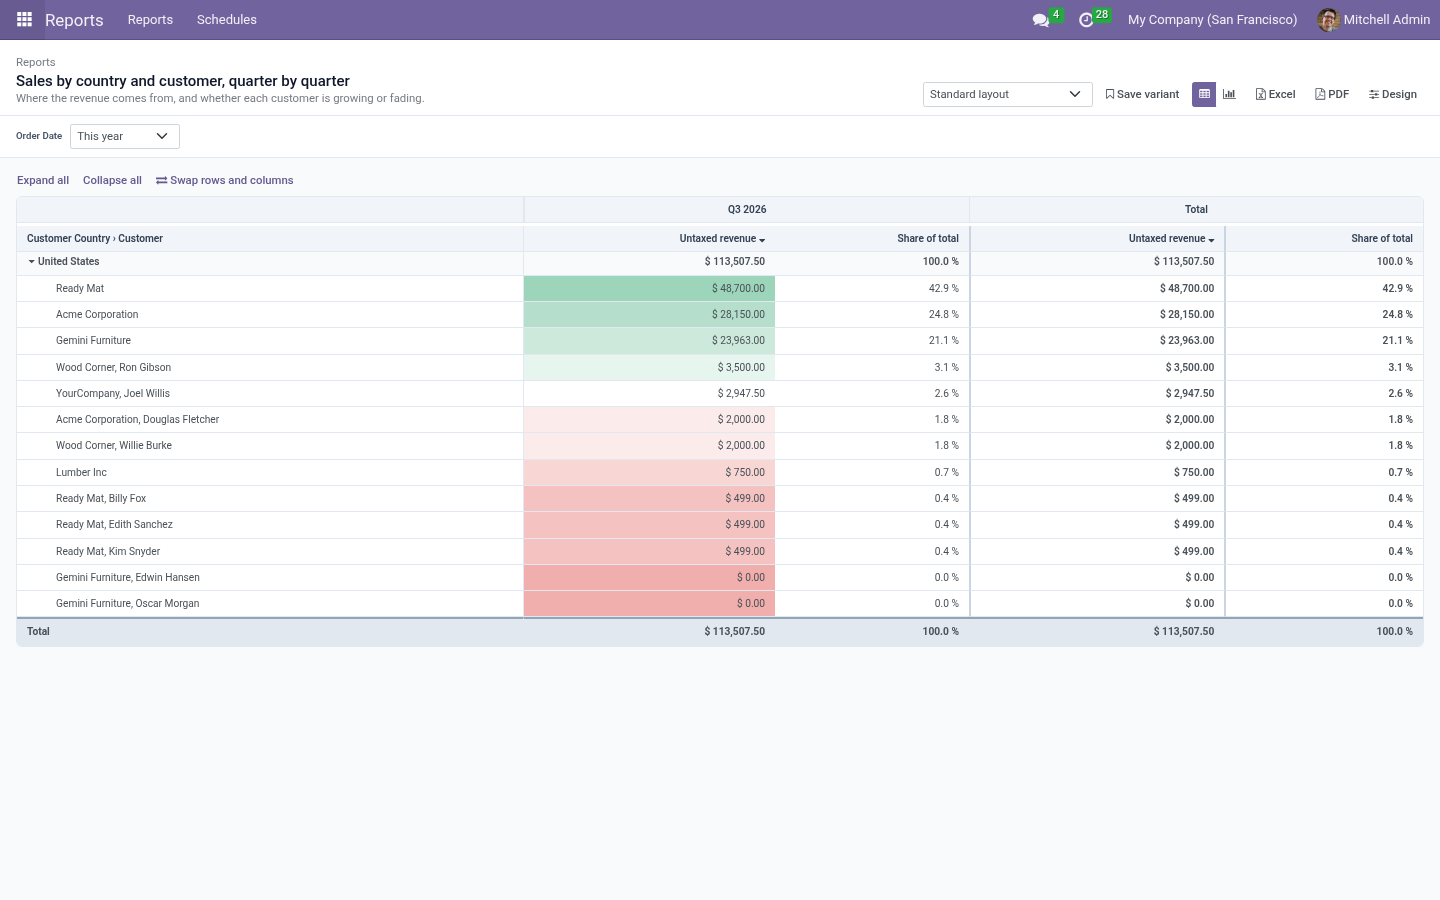
Links followed without SQL - group order lines by the country of the customer of their order (Order ▸ Customer ▸ Country), with every access rule still in force.
Numbers that are right at every level - sums, true averages, lowest, highest, filled-in counts, distinct counts, record counts.
Computed columns with total(), parent(), row() and prev() - the column before, for growth month on month.
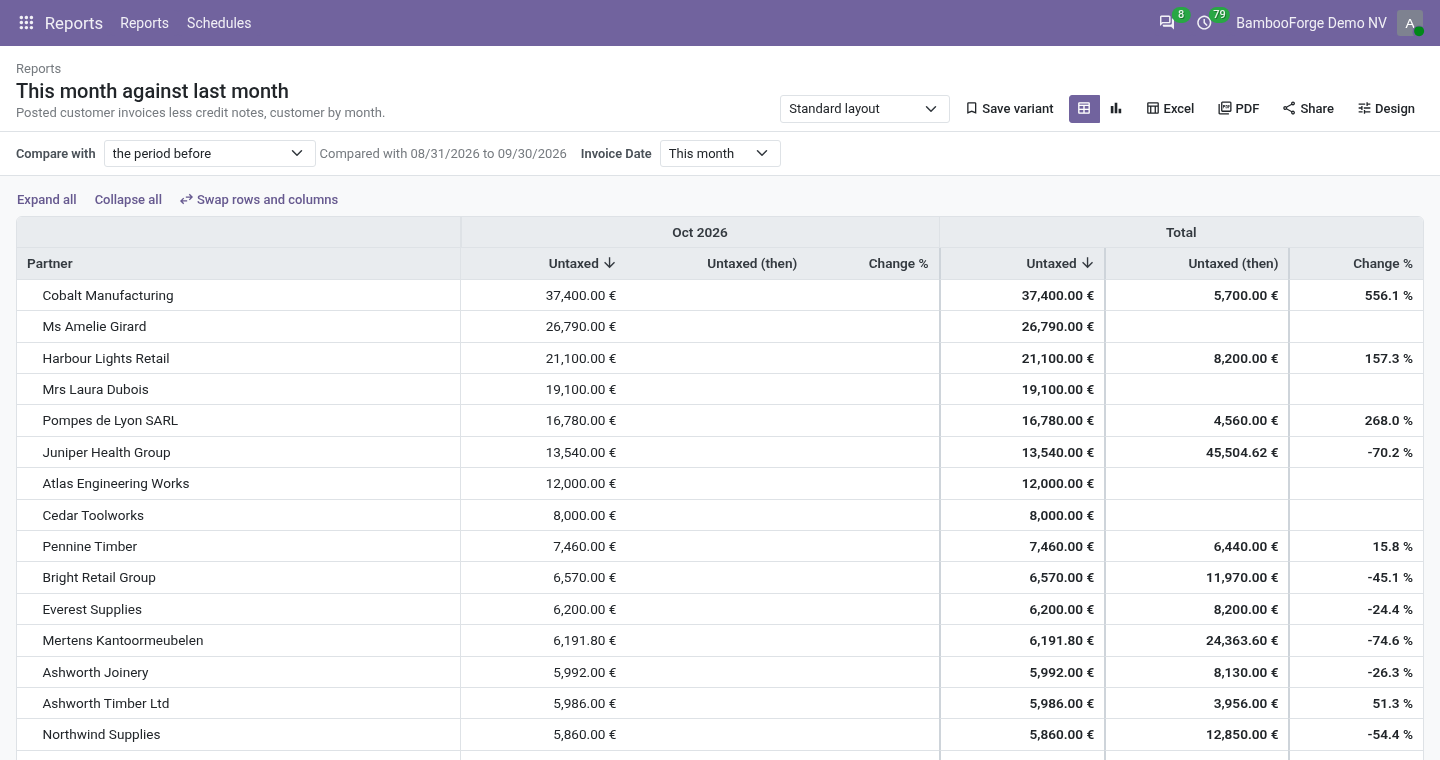
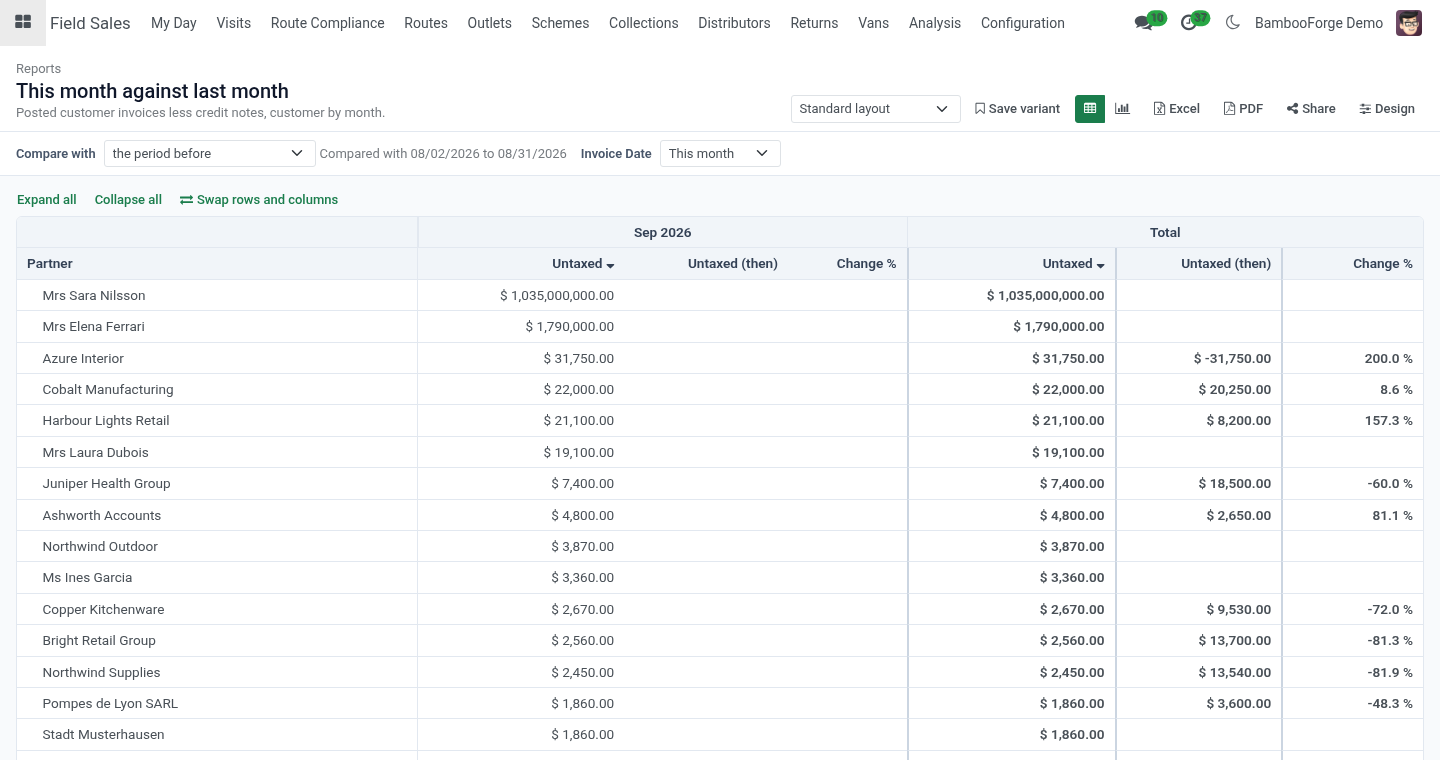
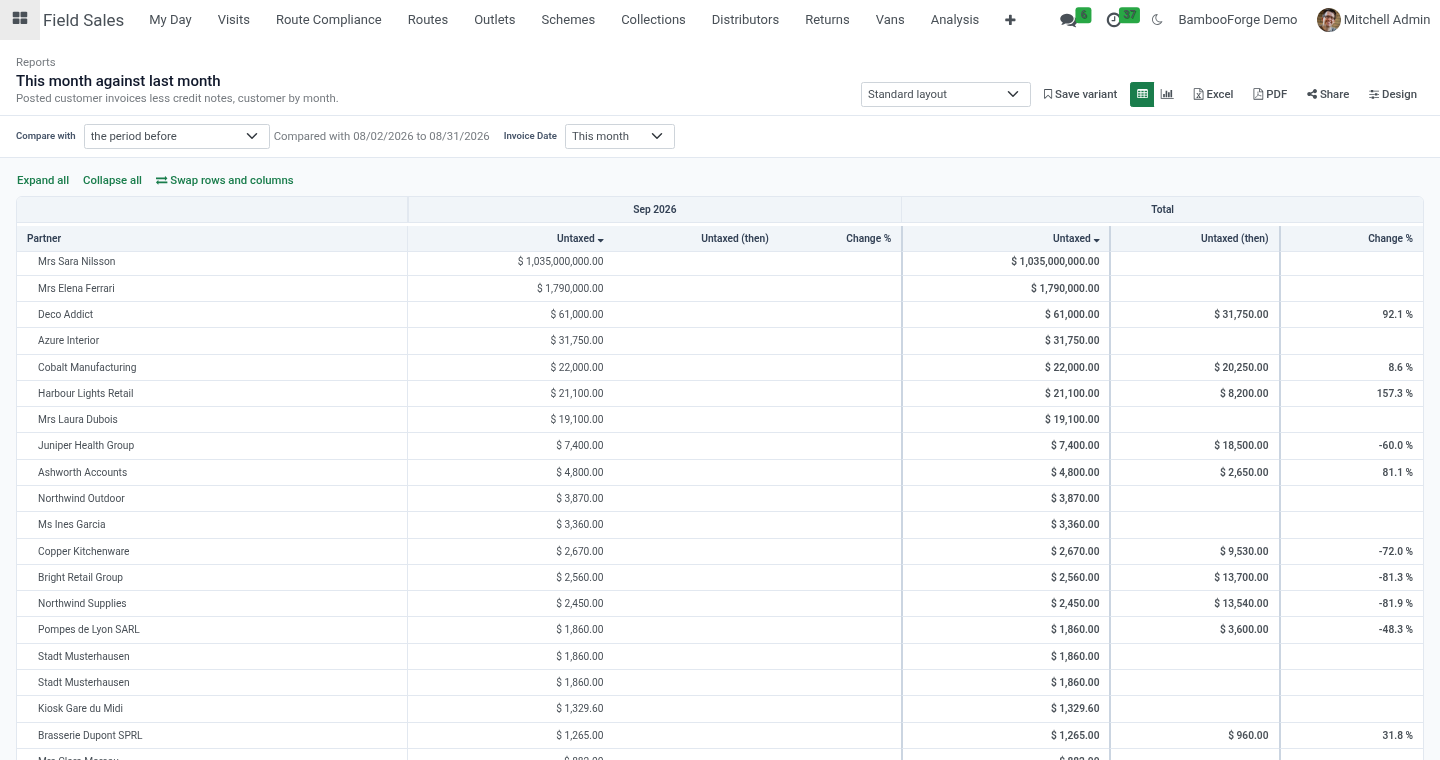
Period comparison - the same numbers for the period before, or the same period a year earlier, and the change in percent, next to every column.
Fixed conditions the designer sets and readers can neither see nor lift.
Share links - the report for somebody without a login, computed with your access, until the date you choose.
Highlights - rules and rank-based colour scales.
Questions asked of the reader - periods, records, statuses, numbers, text.
Drill-down from any cell, sort by any column, swap rows and columns, fold and unfold.
Variants - per-user saved layouts, private or shared, one of them the reader's default.
Chart view - bars, lines or pie from the same definition.
Excel with outline levels and cell colours, PDF, and scheduled emails.
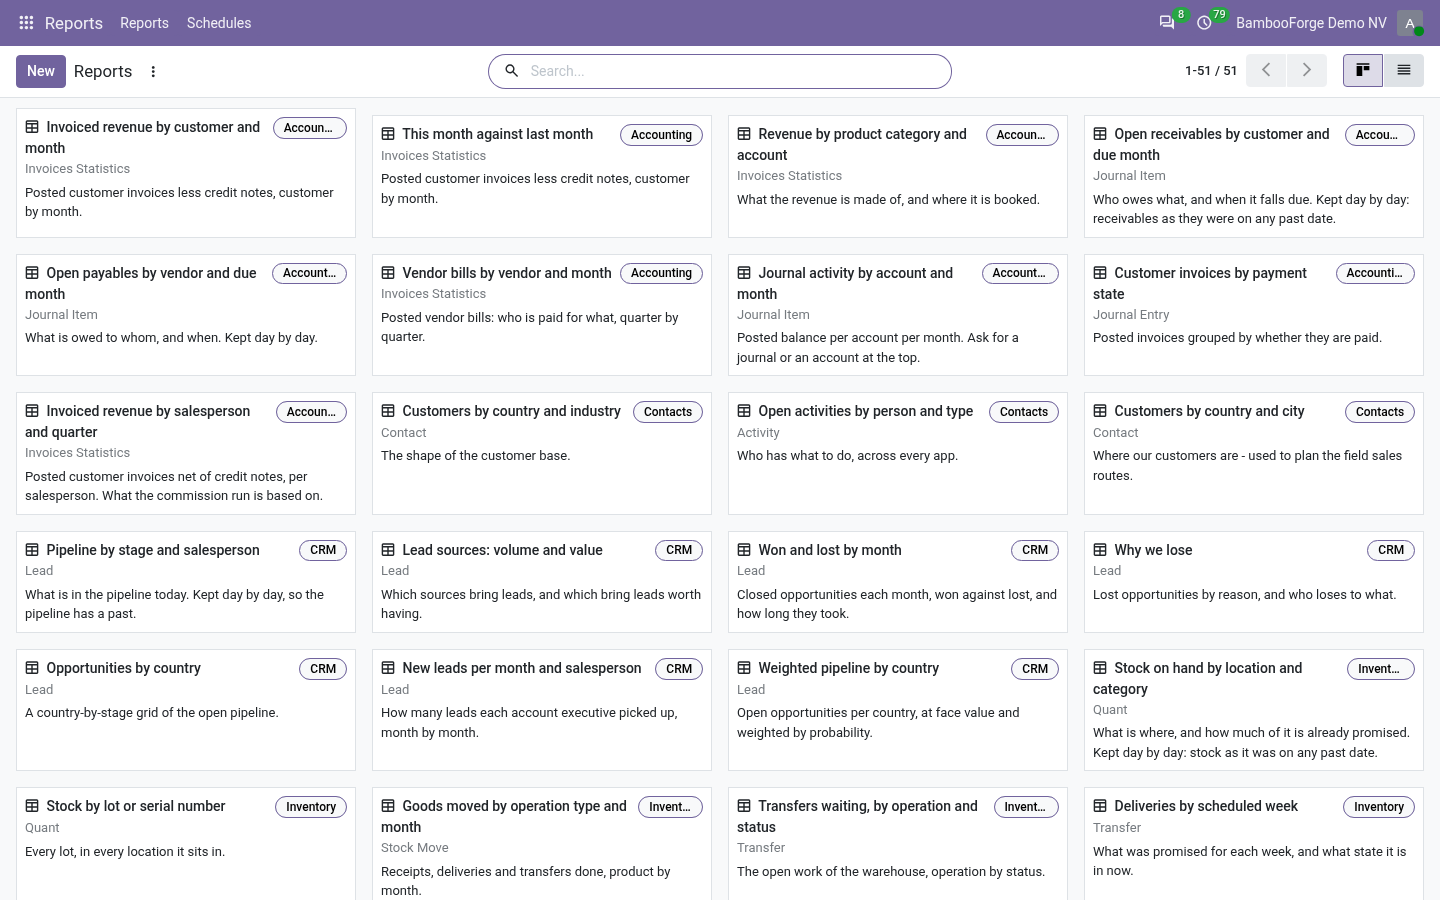
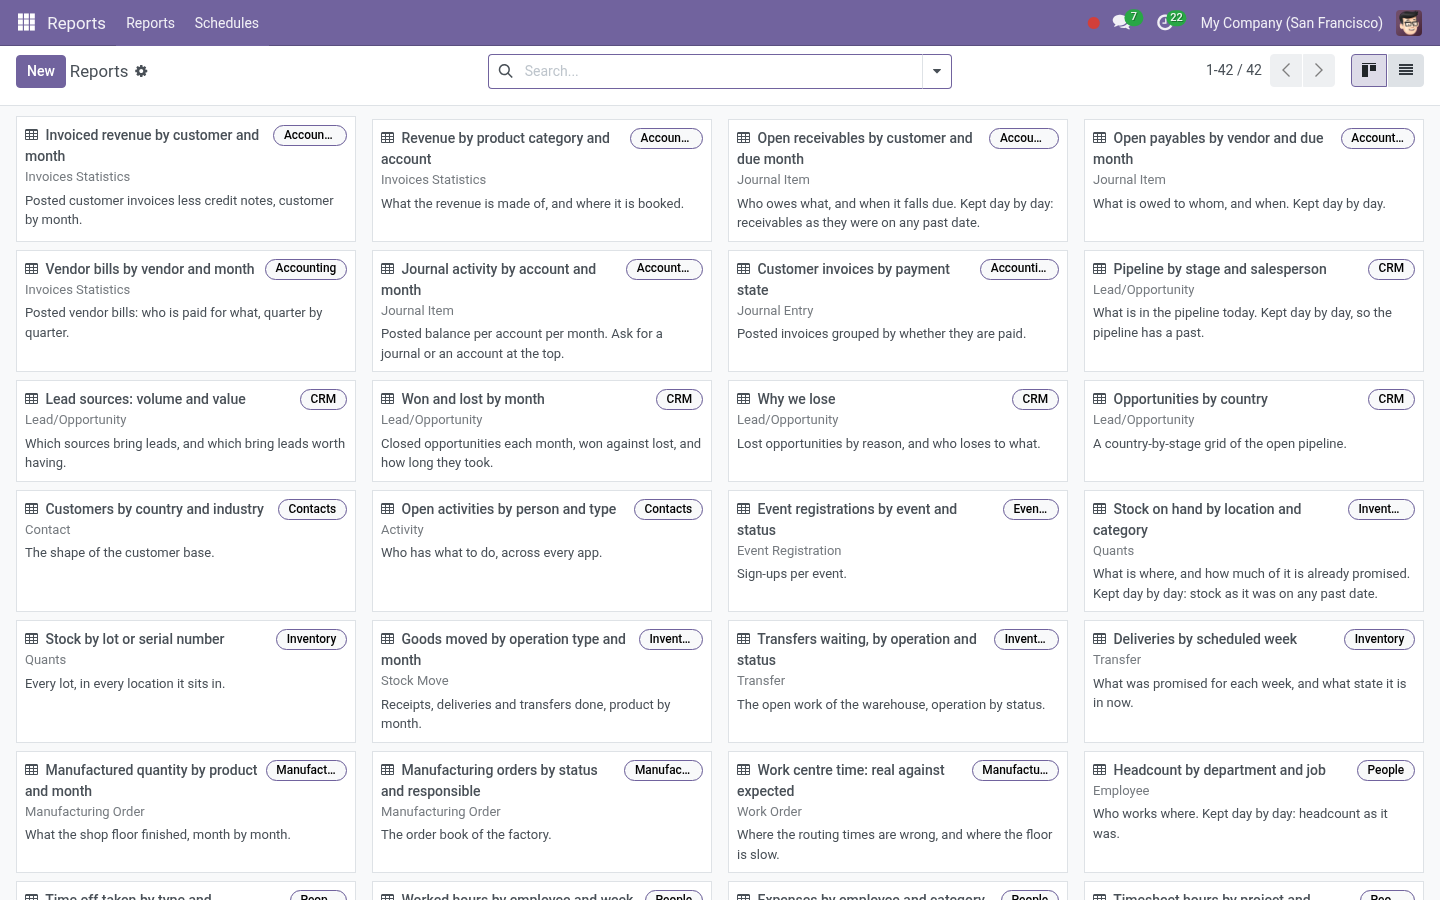
A gallery of about forty ready reports for Sales, CRM, Accounting, Inventory, Purchase, Manufacturing, People, Project and Point of Sale.
A daily history of a report's totals: balances as they stood on a past date.
Requirements
Odoo: 20.0, Community or Enterprise.
Dependencies: only web and mail (Discuss), which every database has. The gallery reports appear for the business apps you have installed; none of them is required.
Python: nothing beyond a standard Odoo install (xlsxwriter ships with Odoo; PDF needs wkhtmltopdf like every Odoo PDF).
Access: every internal user reads reports and keeps variants. A Report Designer (Settings ▸ Users ▸ Report Builder) creates reports, saves standard layouts and manages schedules. The administrator is one by default.
Network: none. Nothing leaves your database.
Install
Copy bambooforge_report_builder into your addons path and restart Odoo.
Apps ▸ Update Apps List, search for Report Builder, Activate.
Open the new Reports app. The gallery is already there.
The gallery
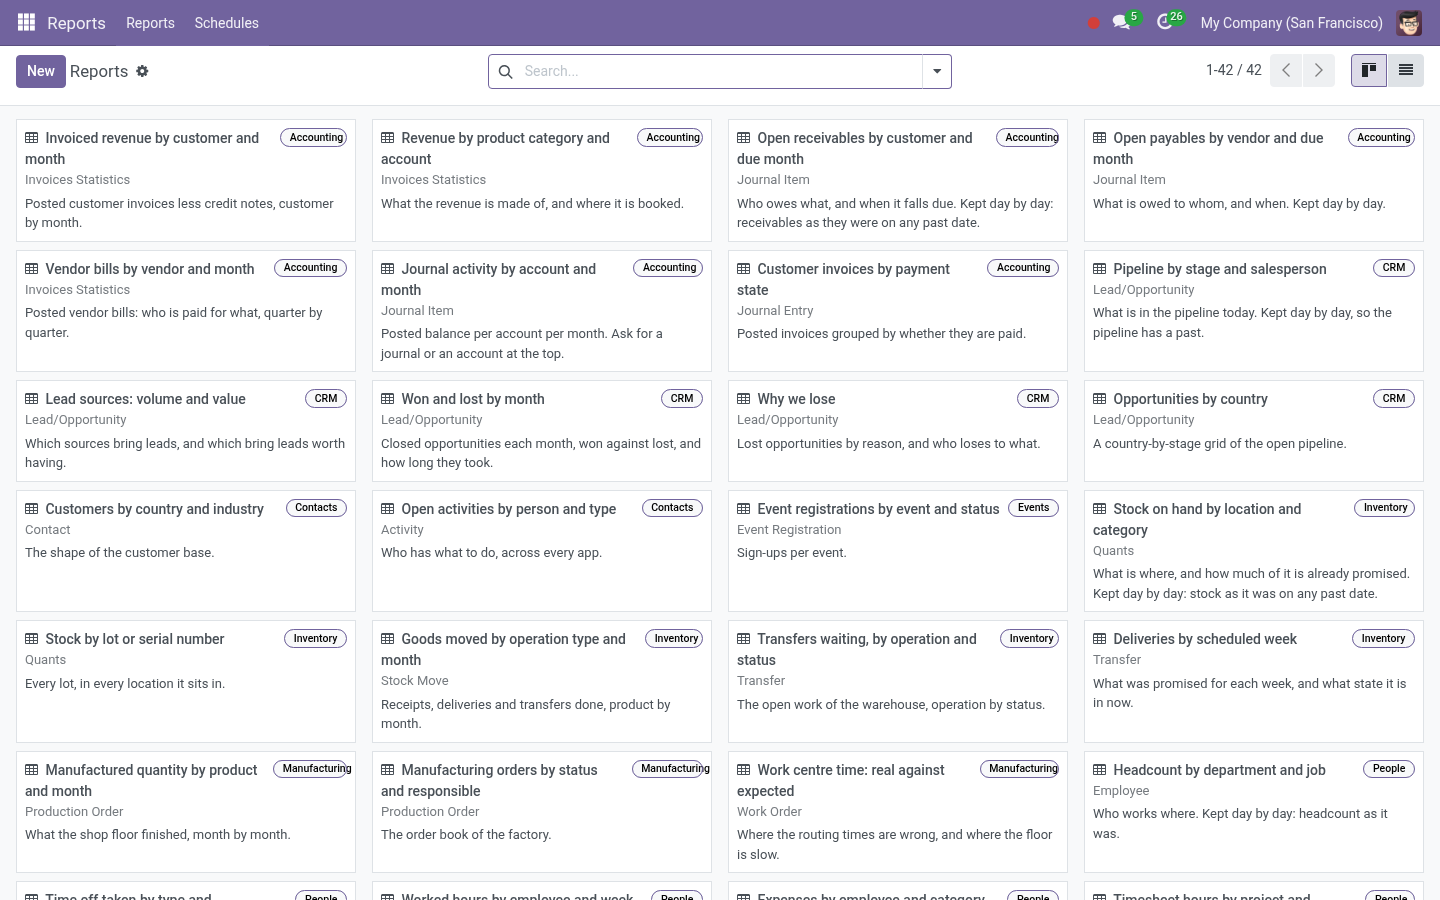
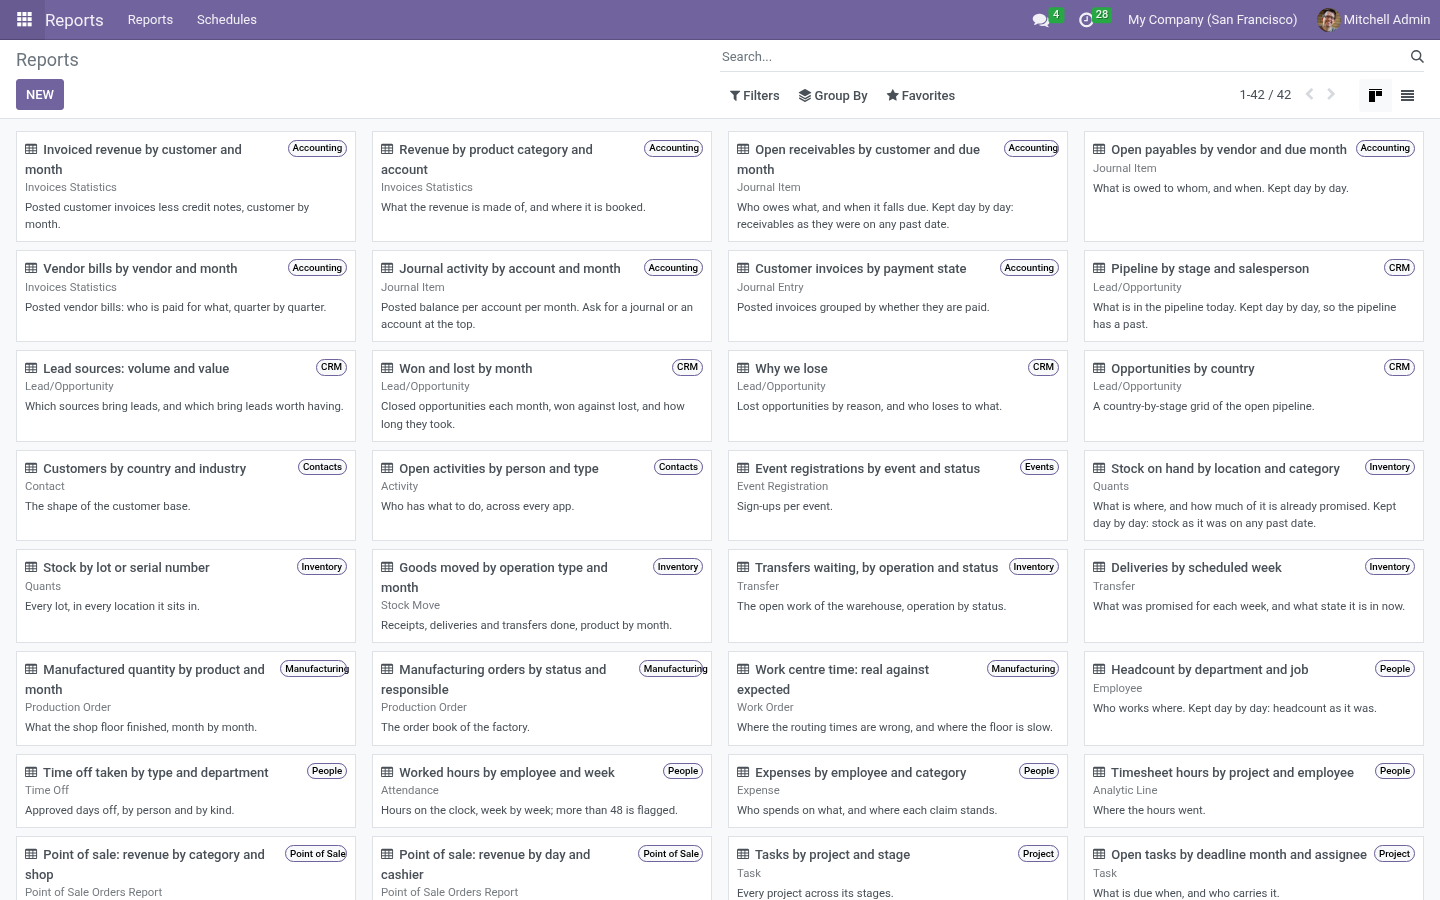
The list is not empty on the first day. Some forty reports are created for the apps you have installed - Sales, CRM, Accounting, Inventory, Purchase, Manufacturing, People, Project, Point of Sale - each one a working example you can open, bend and save under another name. Install another app later and press Action ▸ Load the report gallery in the list view: the reports for the new app arrive, and nothing you already have is touched. A gallery report you do not want is archived, not deleted - a deleted one would come back with the next upgrade.
Reading a report
Fold and unfold a row with its arrow; Expand all and Collapse all are above the table.
Click any number to open the records it counts - the cell's row, its column and every answer at the top of the screen are applied for you.
Click a column heading to sort by it: largest first, smallest first, back to the labels.
Swap rows and columns turns the table on its side.
The questions under the title (a period, a customer, a journal...) are the ones the designer chose to ask. A date question offers This month, Last quarter, Last 30 days and so on, or two dates of your own.
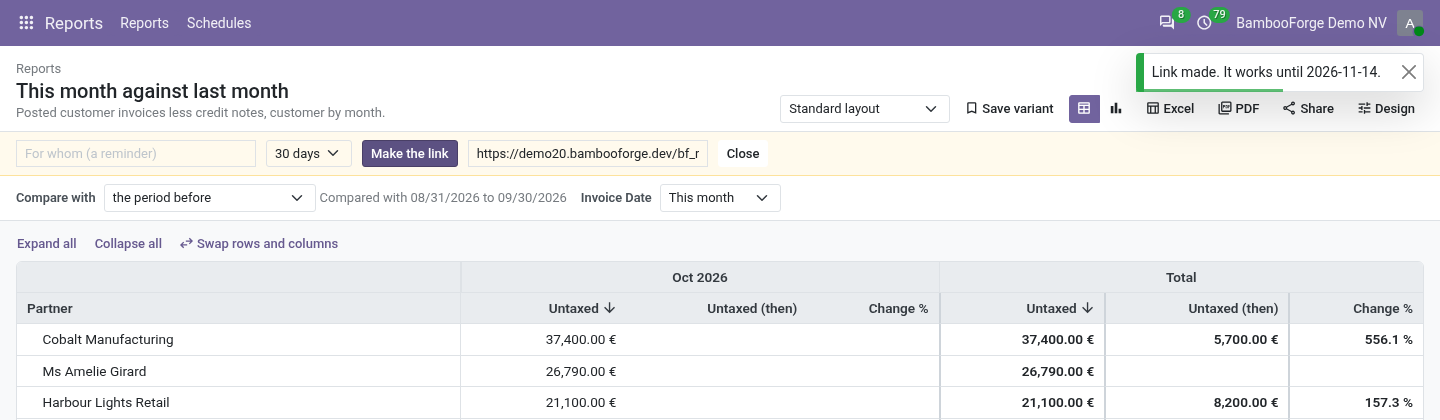
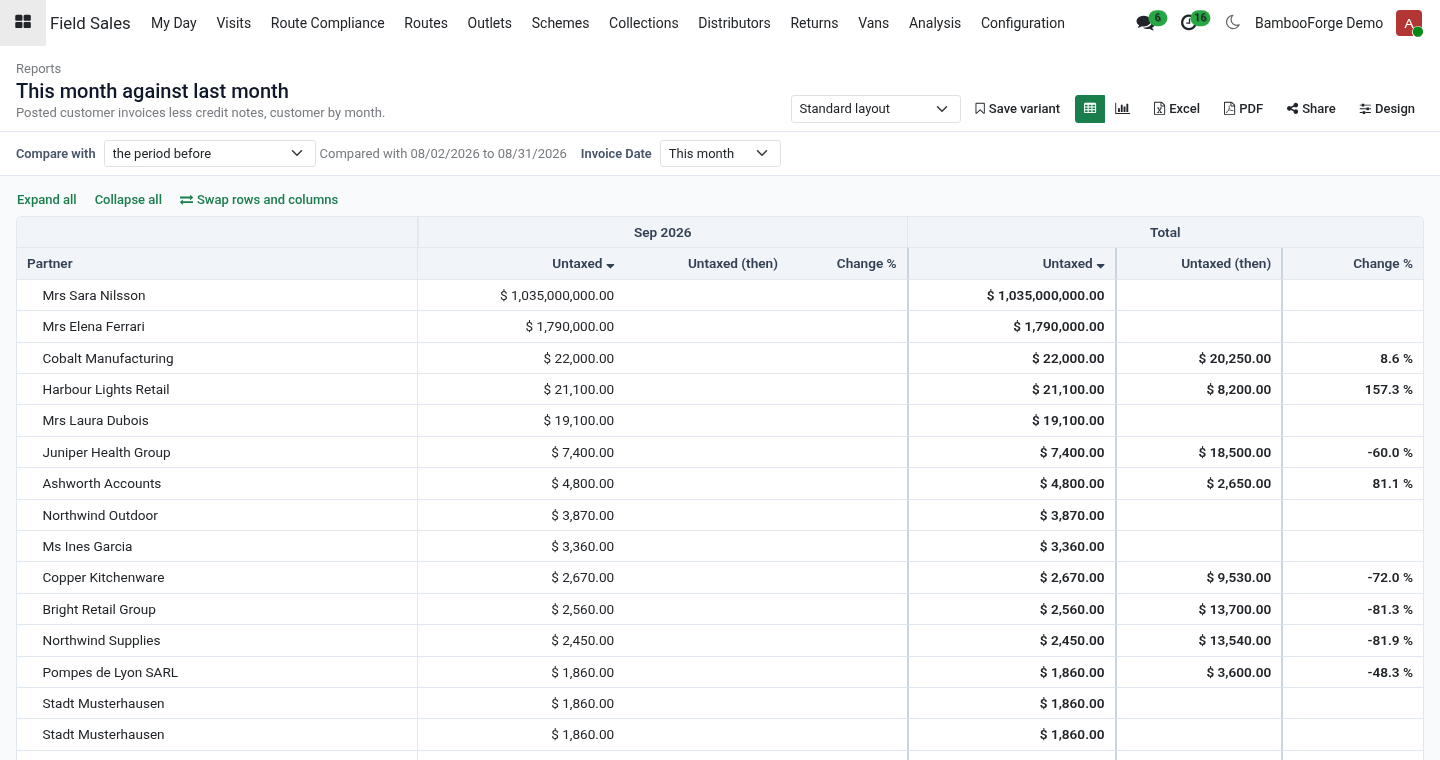
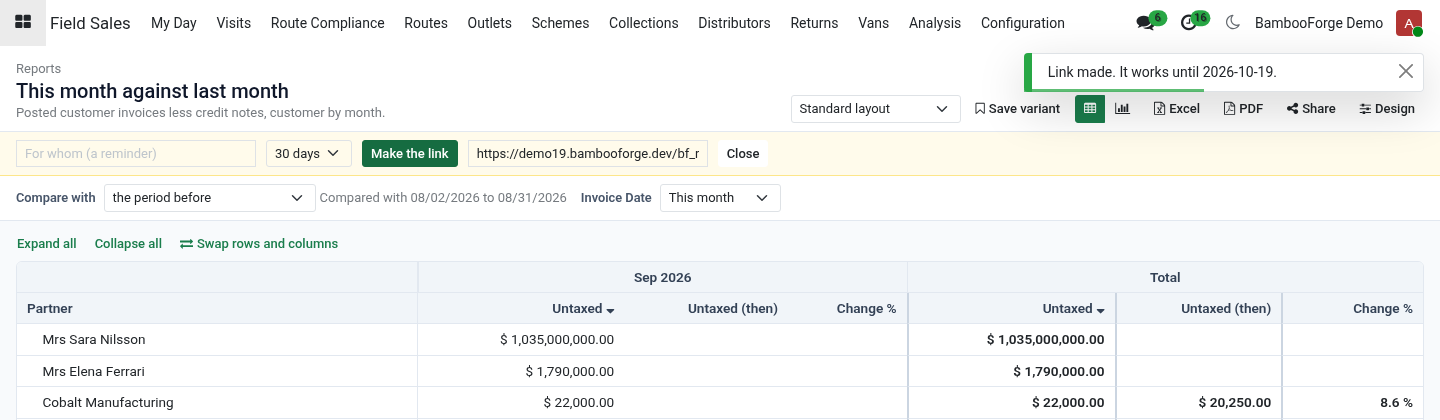
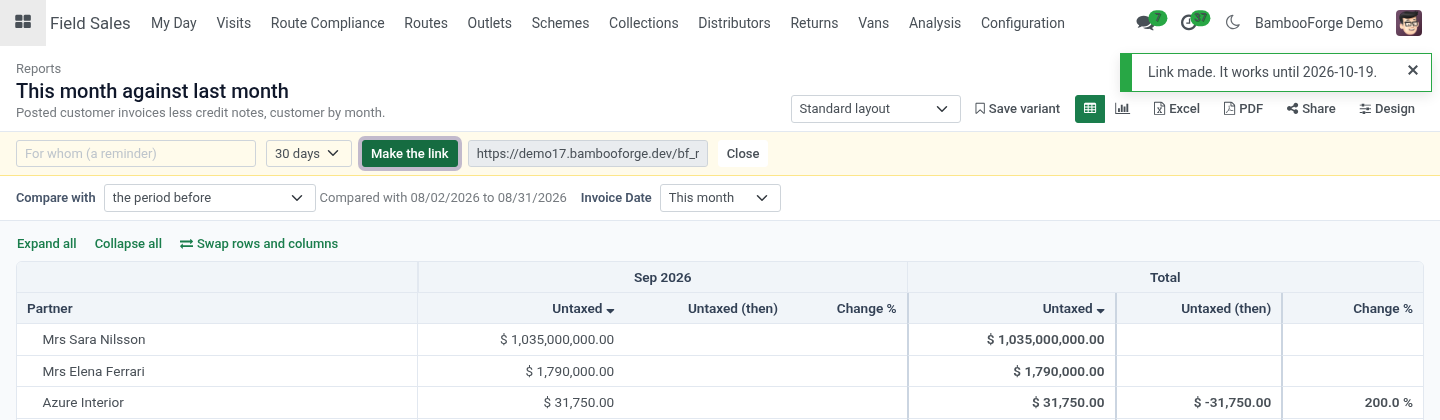
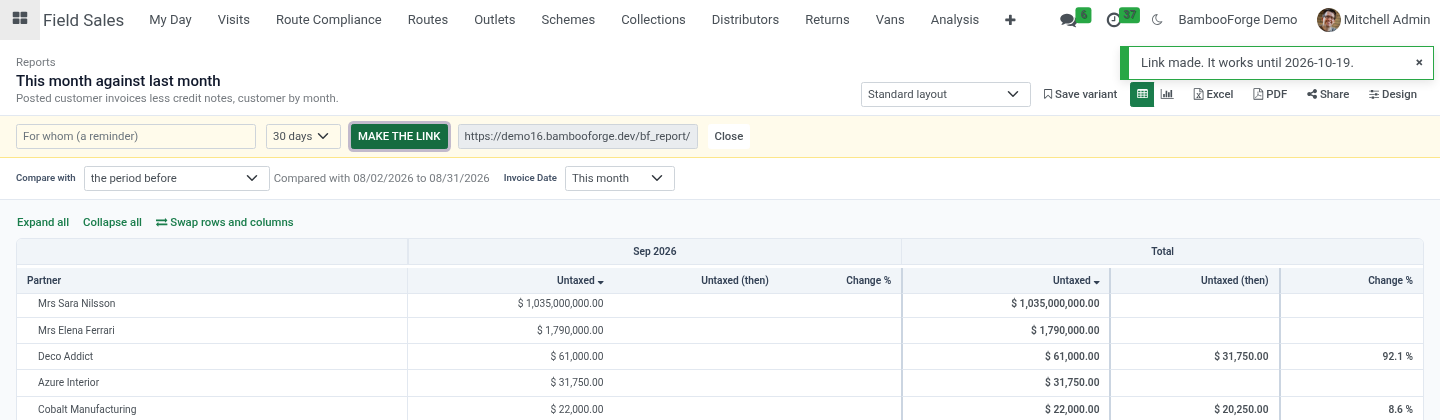
Compare with (shown when the report asks a period): the period before - as long as the one asked, just before it, so Last 30 days against the 30 days before - or the same period a year before. Every number gets two neighbours: its value then, and the change in percent. Rows are matched by what they are (the customer, the country), so a grouping by date compares each month with itself; put dates across the columns and use prev() for month on month.
Share makes a link for somebody without an Odoo login - an accountant, a partner, a board member - valid 7, 30, 90 days or a year. They see the report as laid out when you shared it, recomputed each time they open it, with your access, and nothing else of Odoo. The report's form lists the links, their views, and Withdraw.
Table / chart - the same definition as bars, lines or a pie: the first row level, one series per column.
Excel downloads what you see: your layout, your answers, the rows you folded left out. Nested rows arrive as Excel outline levels, so the workbook folds where the screen does, and the highlights come along. PDF prints the same table.
Every reader counts only what their own access lets them read. A salesperson who sees their own opportunities gets their own totals from the same report the sales manager opens.
Variants - your own way of looking, kept
Change anything - the grouping, the period, the sort - and press Save variant. Give it a name; tick Share with everybody to offer it to your colleagues, and Open the report with it to make it your starting point. Variants are yours: nobody else can change or delete them, and saving under somebody else's shared variant makes a copy of your own. The report's standard layout, the one everybody starts from, is changed only by a Report Designer (Design ▸ Save as standard).
Designing a report
A Report Designer creates a report in three steps.
Reports ▸ New: a name, what it reads and, if not every record counts, a filter. Pick the most detailed kind of record - order lines rather than orders - because a report can climb from a line to its order, the order's customer and the customer's country, but not down again.
Open Report, then Design.
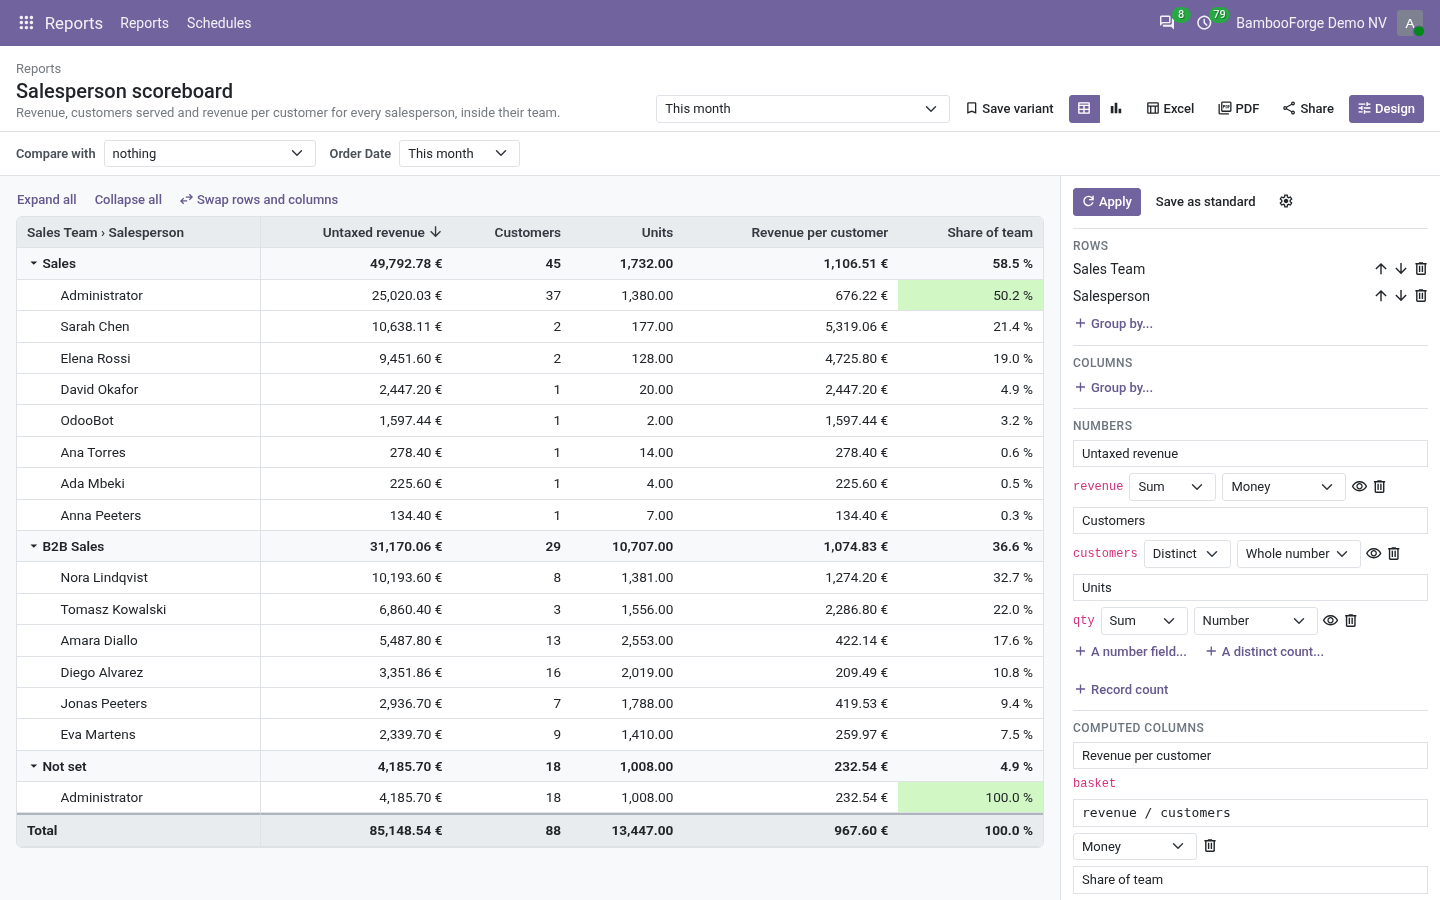
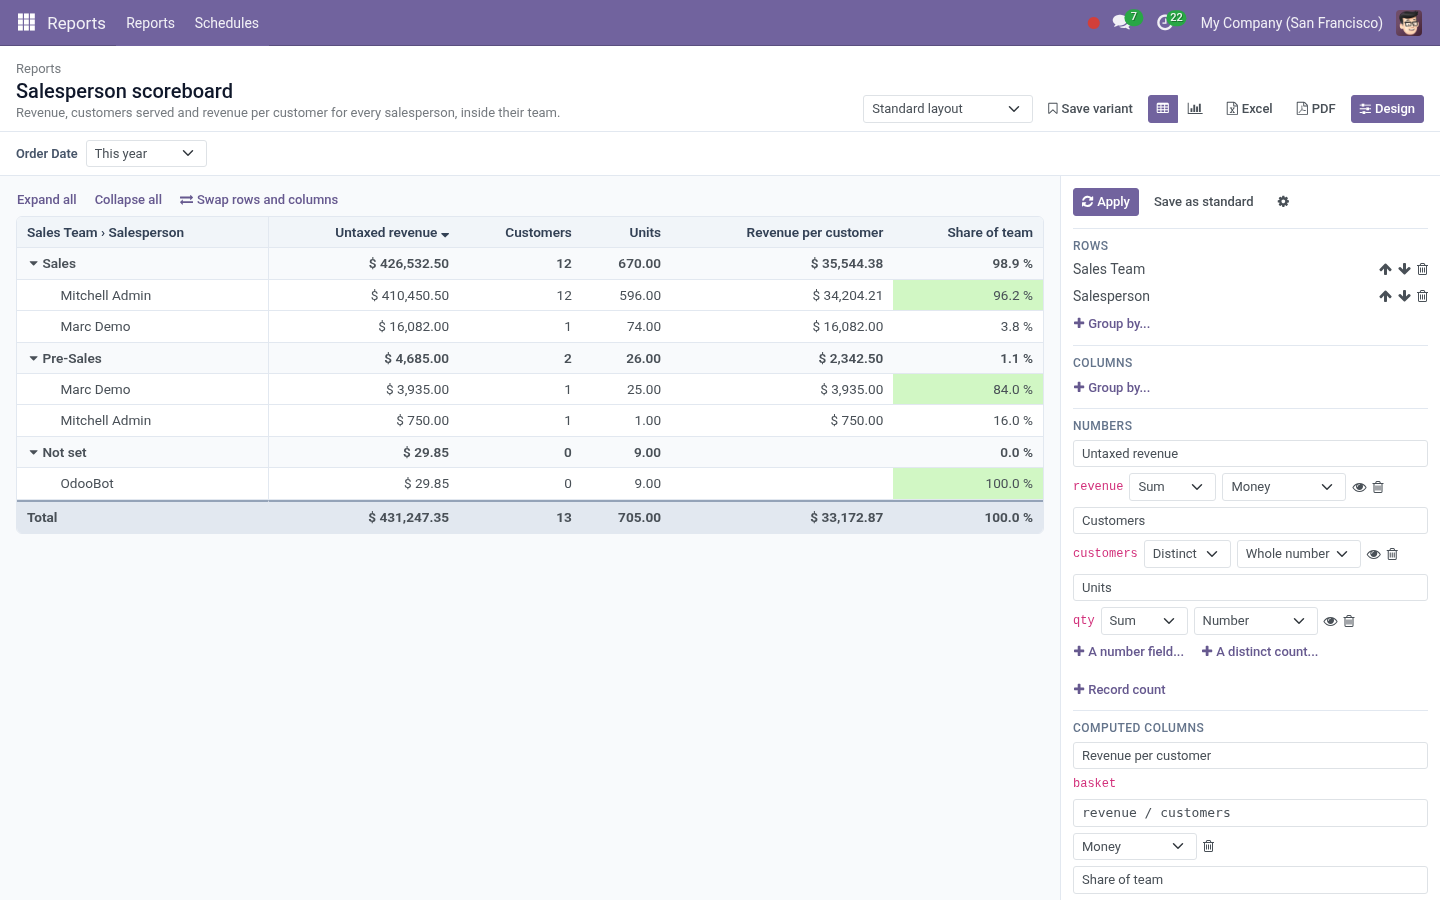
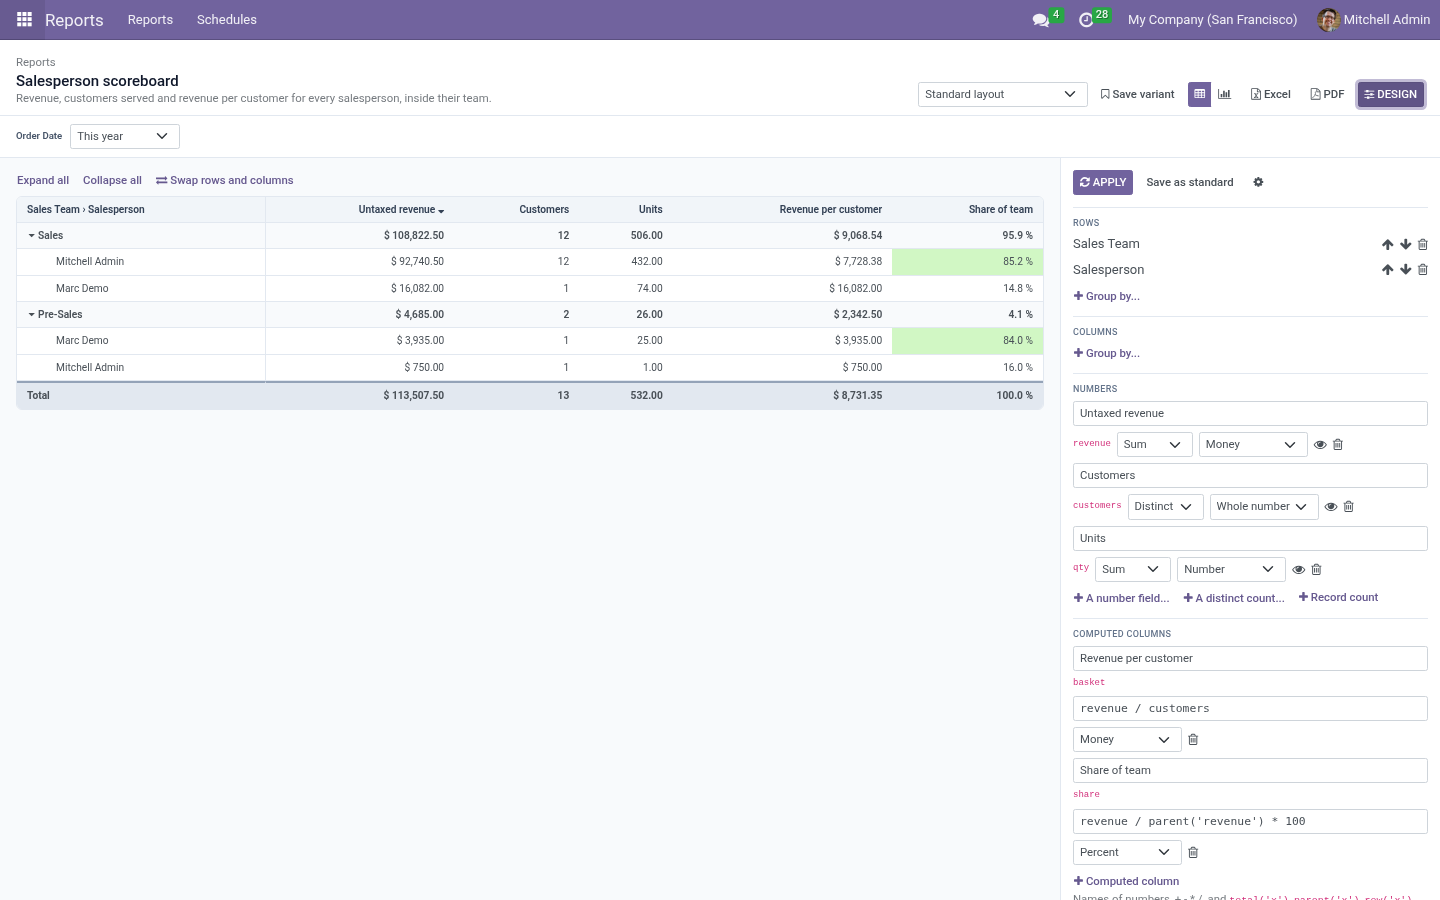
Build the layout in the panel on the right, press Apply to see it, and Save as standard when it is right.
The panel, top to bottom:
- Rows and Columns
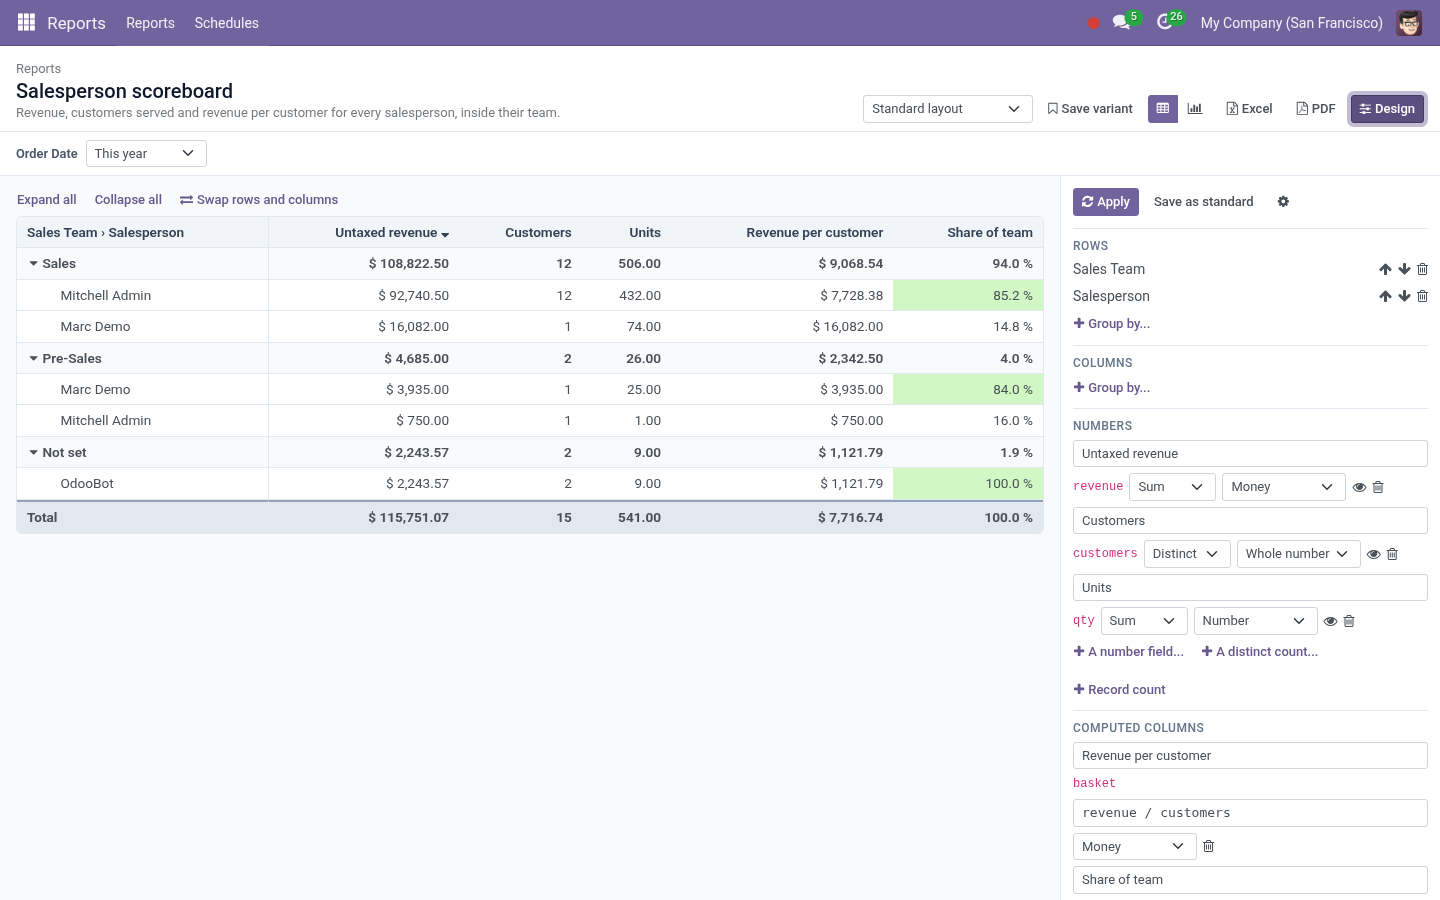
Group by... offers the fields of the model. A field with an arrow is a link: choose it and a second list opens with the fields of the record it points to, up to two links away (Order ▸ Customer ▸ Country). A date is grouped by day, week, month, quarter or year. Up to five row levels and two column levels.
- Numbers
A number field with Sum, Average, Lowest, Highest or Filled in; a distinct count (how many different customers); or the record count. Each number has a short name shown in red - revenue, m1 - which is how computed columns refer to it. The eye hides a number that is only there to feed a computed column.
Averages are true averages at every level, not averages of averages. A distinct count is asked of the database again at every level, because distinct counts cannot be added up; for that reason it cannot be combined with a grouping that follows a link.
- Computed columns
Arithmetic on the numbers of the same cell: margin / revenue * 100. Four functions look outside the cell: total('revenue') is the grand total, parent('revenue') the row one level up, row('revenue') the row's own total column, prev('revenue') the same row in the column before. So revenue / total('revenue') * 100 is a share of the whole, revenue / parent('revenue') * 100 a share of the group, and with months across, (revenue / prev('revenue') - 1) * 100 the growth on the month before (empty in the first column and the total column). Also abs, round, min, max and a if a > b else b. A division by zero leaves the cell empty. Nothing else is accepted - the expression is checked when the report is saved.
- Highlights
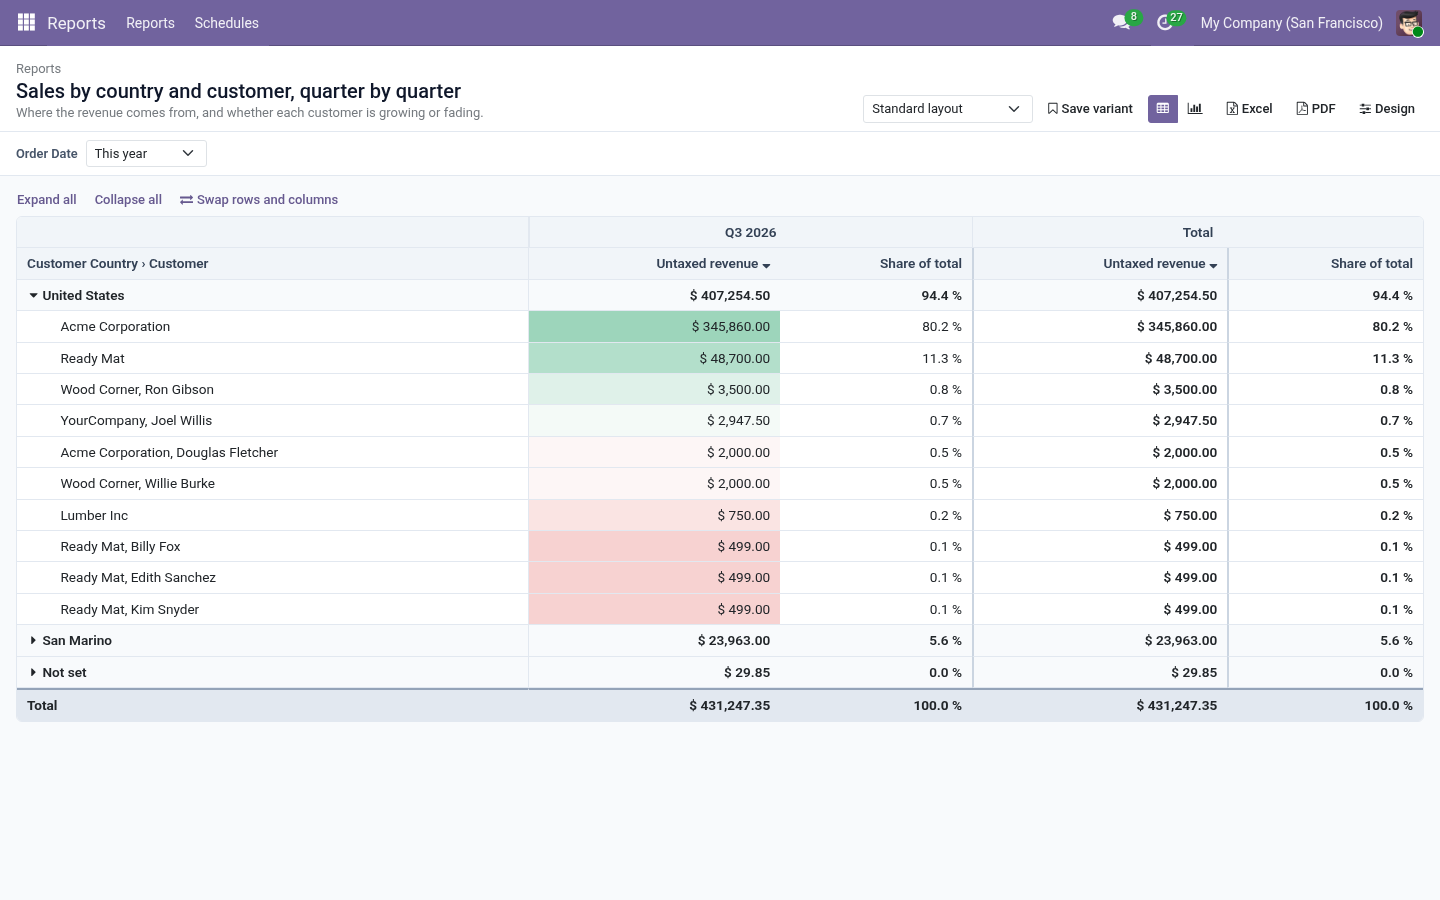
A rule colours the cells that pass a test (>= 2000, between). A colour scale shades the lowest rows red and the highest green - by rank, so one giant customer does not wash out everybody else; tick high is bad for overdue amounts and lead times.
- Questions asked of the reader
Pick a field and it becomes an input above the report: a period for a date, a search box for a customer or product, a list for a status, a number test, or a text search. Tick fixed, hidden and it becomes a condition of the report instead: set its value while designing; readers do not see it and cannot change it - not on screen, not in a variant, not in an export or a drill-down. (The report's own filter on its form does the same for conditions nobody needs to see set.)
- Order and size
Sort by a number, show only the top N first-level rows (the total still counts everything, and the screen says so), and how many levels open unfolded.
History - what the number was
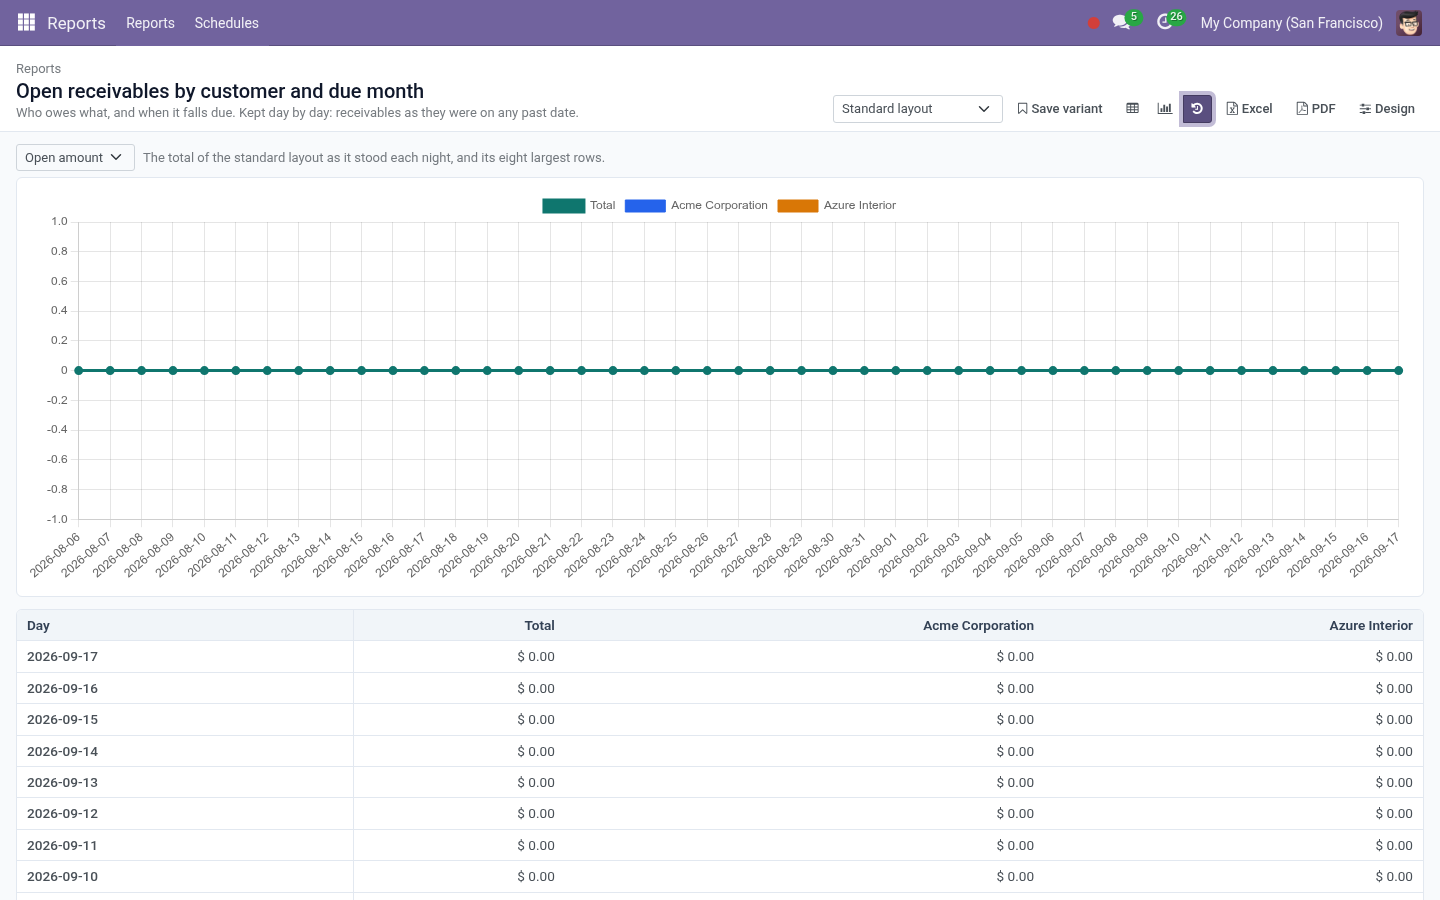
Odoo knows what stock you hold and who owes you money today; it cannot tell you what either was on the first of last month. Tick Keep a Daily History on a report and every night its totals - the grand total and each first-level row - are written down, computed with the access of the user you name. The clock button on the report then shows the total day by day, the eight largest rows beside it, as a chart and as a table. Several gallery reports keep a history out of the box: stock on hand, open receivables, open payables, the pipeline, delivered-not-invoiced, headcount. Write Today's History on the report form takes an entry at once.
Reports by email
Reports ▸ Schedules (Report Designers only). A schedule names reports, people and a rhythm:
Send As: Excel workbook, PDF, or both. Each report goes out in its standard layout.
Computed As: the reports are computed with this user's access, and the recipients receive what that user would see. Choose somebody who may see everything the report counts, and recipients who may see it too.
To Users, To Contacts, Other Addresses: anybody with an email address.
Every day, every week on a weekday, or every month on a day from 1 to 28, not before an hour in the timezone you pick.
An hourly scheduled action sends what is due. A schedule sends once per period whatever happens - the day, week or month it last sent for is written on it - so a restarted server or a second cron run never doubles an email. Send Now ignores the rhythm. A report that cannot be computed is left out and noted in the schedule's chatter; the others still go.
Access and privacy
A report is listed to the groups named under Visible To (everybody when empty). That decides who may open it.
What it counts is decided by the reader's own access rights and record rules, every time: the same report gives a salesperson their own figures and the manager everybody's. Nothing is computed with elevated rights except the nightly history and schedules, which run as the user you name on them.
Variants are private to their owner unless shared; a shared variant is still changed and deleted by its owner alone.
Computed columns accept arithmetic and six functions. They are parsed, not executed: there is no Python to inject.
Multi-company: a report can belong to one company or to all; the numbers follow the companies the reader has switched on.
Troubleshooting
- "... is computed on the fly and cannot be grouped"
The field is not stored in the database, so the database cannot group by it. Reach the same information through a stored link (for example Product ▸ Category instead of a computed Category shortcut).
- "A measure must be a stored field of ..."
Numbers are added up by the database and must be stored fields of the model the report reads. Read the more detailed model (lines, not documents), or one of Odoo's analysis models.
- "A distinct count cannot be combined with a grouping that follows a link"
Remove the linked grouping, or replace the distinct count with a record count.
- The table says it is cut
The layout produces more than 20,000 combinations. Group by fewer fields, a coarser date interval, or answer a question to narrow the records.
- A gallery report is missing
Its app was installed after this one. Reports ▸ list view ▸ Action ▸ Load the report gallery. A report whose fields do not exist on your Odoo series is skipped and named in the server log.
- The history is empty
It is written at night. Write Today's History on the report form takes the first entry now.
- No email arrives
Check Settings ▸ Technical ▸ Emails for the queued message and your outgoing mail server; check that the recipients have email addresses and that the schedule's hour and weekday have come. The schedule's chatter names any report that could not be computed.
Limits, stated plainly
A report reads one model and whatever it reaches through many2one links. It does not join two unrelated models.
Numbers must be stored fields of the model itself. A computed, non-stored field cannot be summed by the database.
Amounts are added as stored. For money across currencies, read the analysis models - Sales Analysis, Invoices Statistics, Purchase Report - as the gallery does: they hold company-currency amounts.
A layout that produces more than 20,000 combinations is cut, and says so.
Reports are not placed on Odoo's own spreadsheets. With BambooForge Dashboard installed (Odoo 17 and later), the small Report Builder on Dashboards module installs by itself and a dashboard tile or KPI can show a report's grand total.
A share link shows what its creator can see; a link to a report of salaries is a link to salaries. Share what you would print.
The chart draws the first row level only.
Uninstalling
Uninstalling removes the reports, variants, schedules and histories this app created. It touches nothing else: no field is added to any of your models.
Changelog
20.0.1.1.0
Built for Odoo 20: record rules and access rights rewritten onto Odoo 20's single ir.access model, the screens rebuilt on Owl 3, and every icon moved to the icon set Odoo 20 ships.
20.0.1.1.0
Compare with the period before or the same period a year earlier, with the change in percent.
Fixed conditions set by the designer and hidden from readers.
prev('x') in computed columns: the value in the column before.
Share links with an expiry date, computed with the sharer's access.
A report's total as a dashboard tile (new companion module, 17+).
20.0.1.0.0
First release: nested cross-tab reports with links, computed columns, highlights, questions, drill-down, variants, chart view, Excel and PDF, schedules, the report gallery and daily history.
How we make sure it works
Before every release, 32 automated checks run against this app on Odoo 16, 17, 18, 19 and 20. Among them:
A reader cannot redesign the standard layout.
Average is not an average of averages.
The reader counts only what they may read.
Schedule sends once per period.
Expressions are arithmetic only.
The complete list is in the source you receive.