 BambooForge Labs
Gantt View for Projects
A real Gantt chart for Odoo Community: auto-schedule with MS Project constraints, drag to reschedule, links by drag, critical path and float, subtasks, portfolio, workload in hours, baseline, MS Project / Excel / PDF in and out.
Available for Odoo 16.0, Odoo 17.0, Odoo 18.0, Odoo 19.0, Odoo 20.0. Technical name bambooforge_gantt.
Transcript of the walkthrough (Odoo 20)
Gantt View for Projects. A real Gantt chart for Odoo Community: auto-schedule with MS Project constraints, drag to reschedule, links by drag, critical path and float, subtasks, portfolio, workload in hours, baseline, MS Project / Excel / PDF in and out. Community Odoo plans projects in lists and kanbans; the schedule lives in somebody's head. This app draws it — and lets you drag it.
In the next few minutes: gantt view for projects, then what you get, then where the dates come from, then moving tasks, then constraints and the automatic scheduler. Then what this app deliberately does not do, so you can tell before you buy whether it fits. Everything lives under Gantt. 1.
Install BambooForge Project Gantt (depends on Project only). 2. A Gantt menu appears in the Project app, and every project form gets a Gantt smart button scoped to that project. 3.
To see dependency arrows, enable Task Dependencies on the project. 4. Set the project's start date if you want Auto-schedule to pack the plan from it; without one it packs from the earliest bar. Gantt View for Projects.
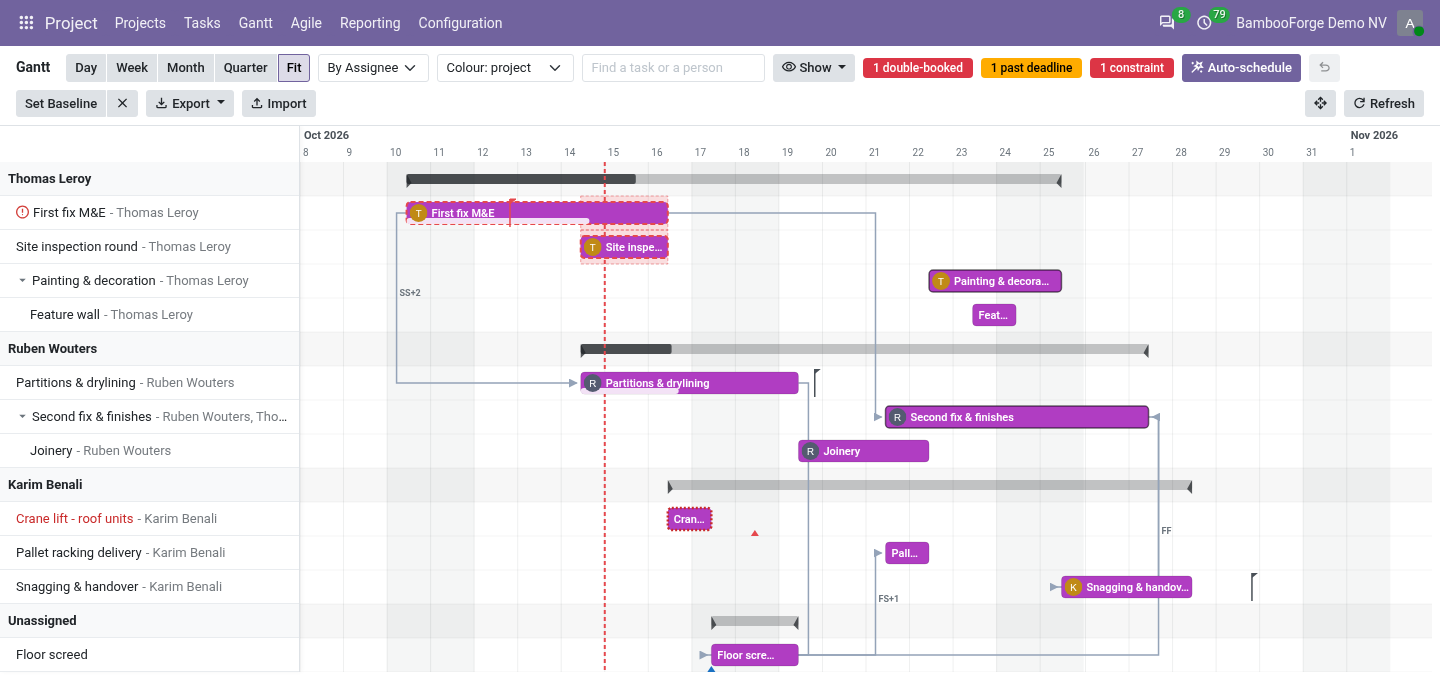
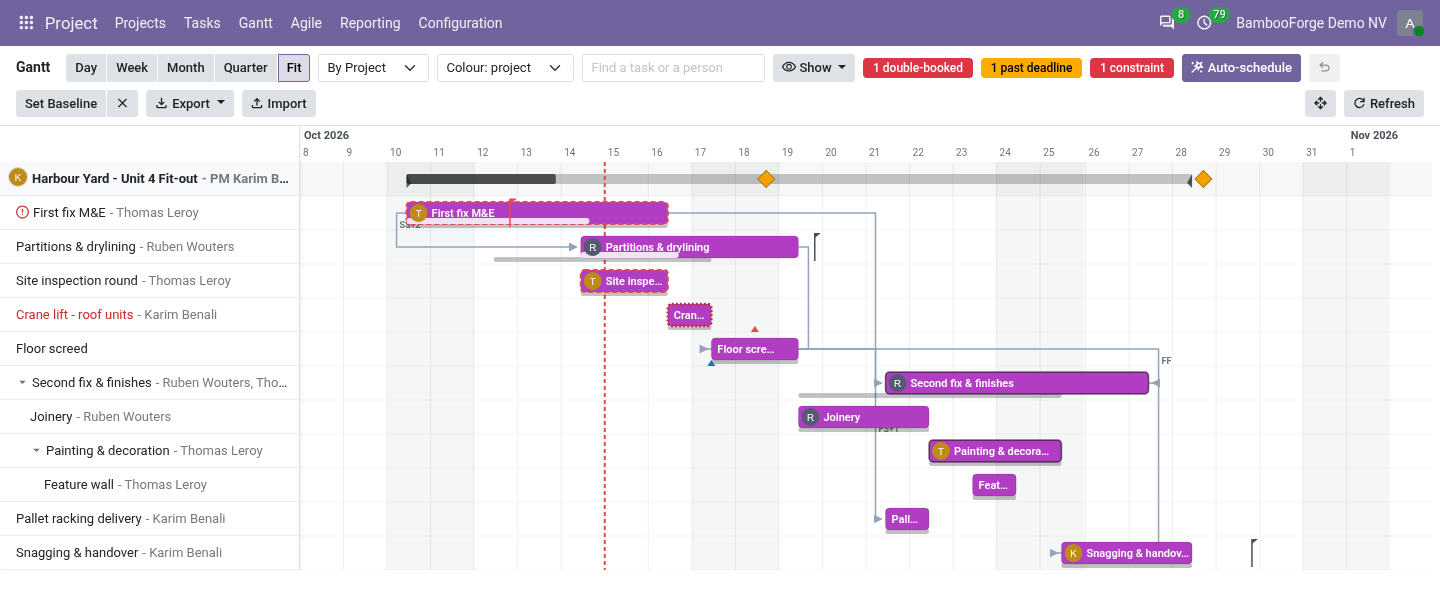
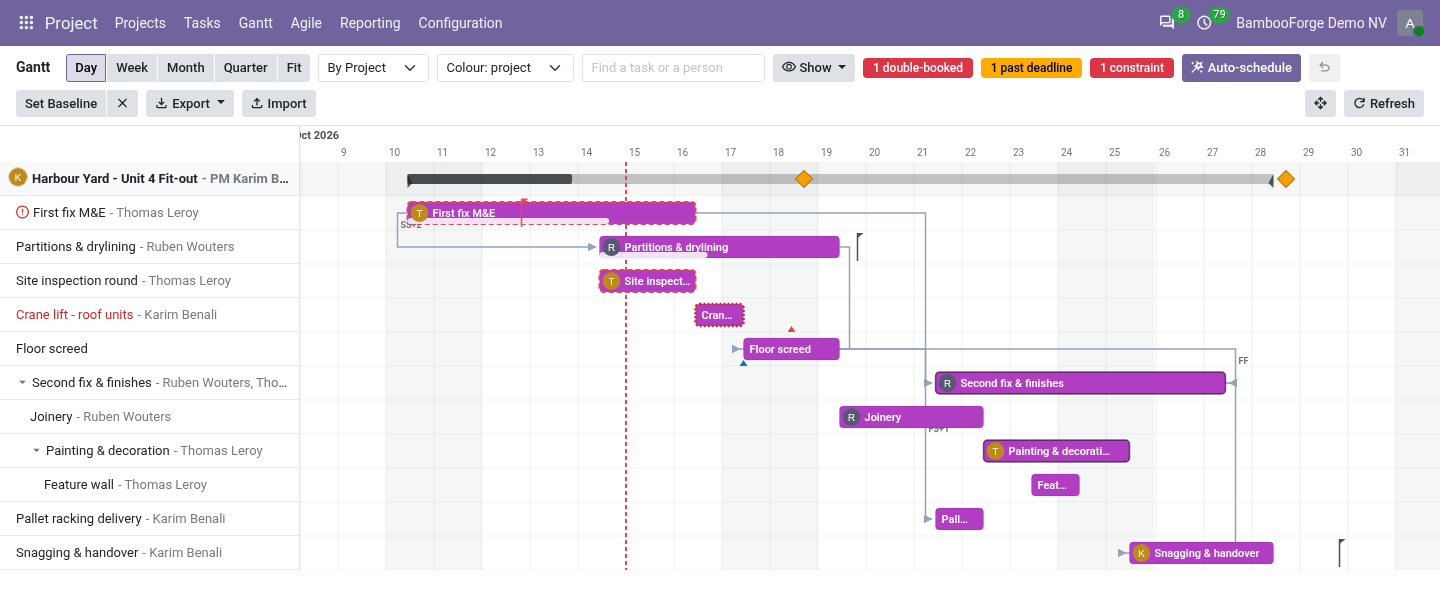
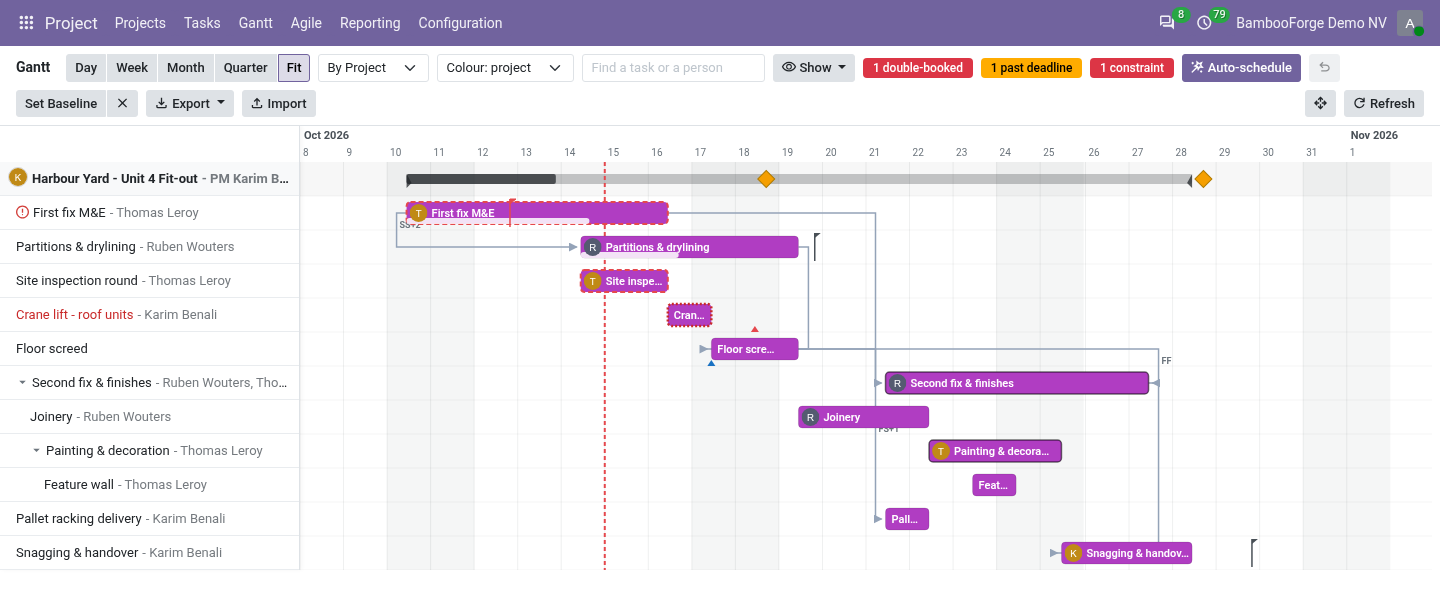
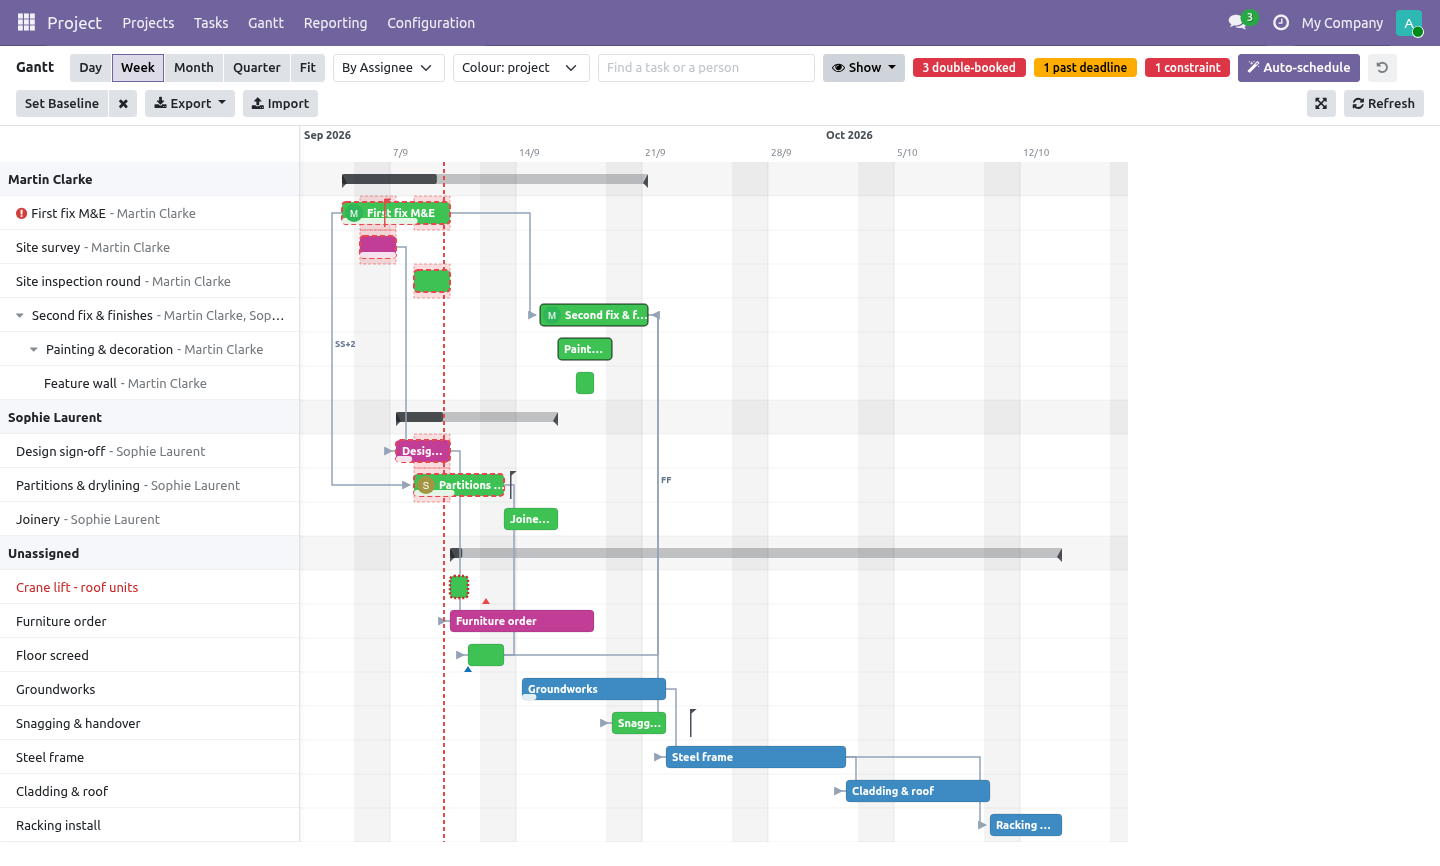
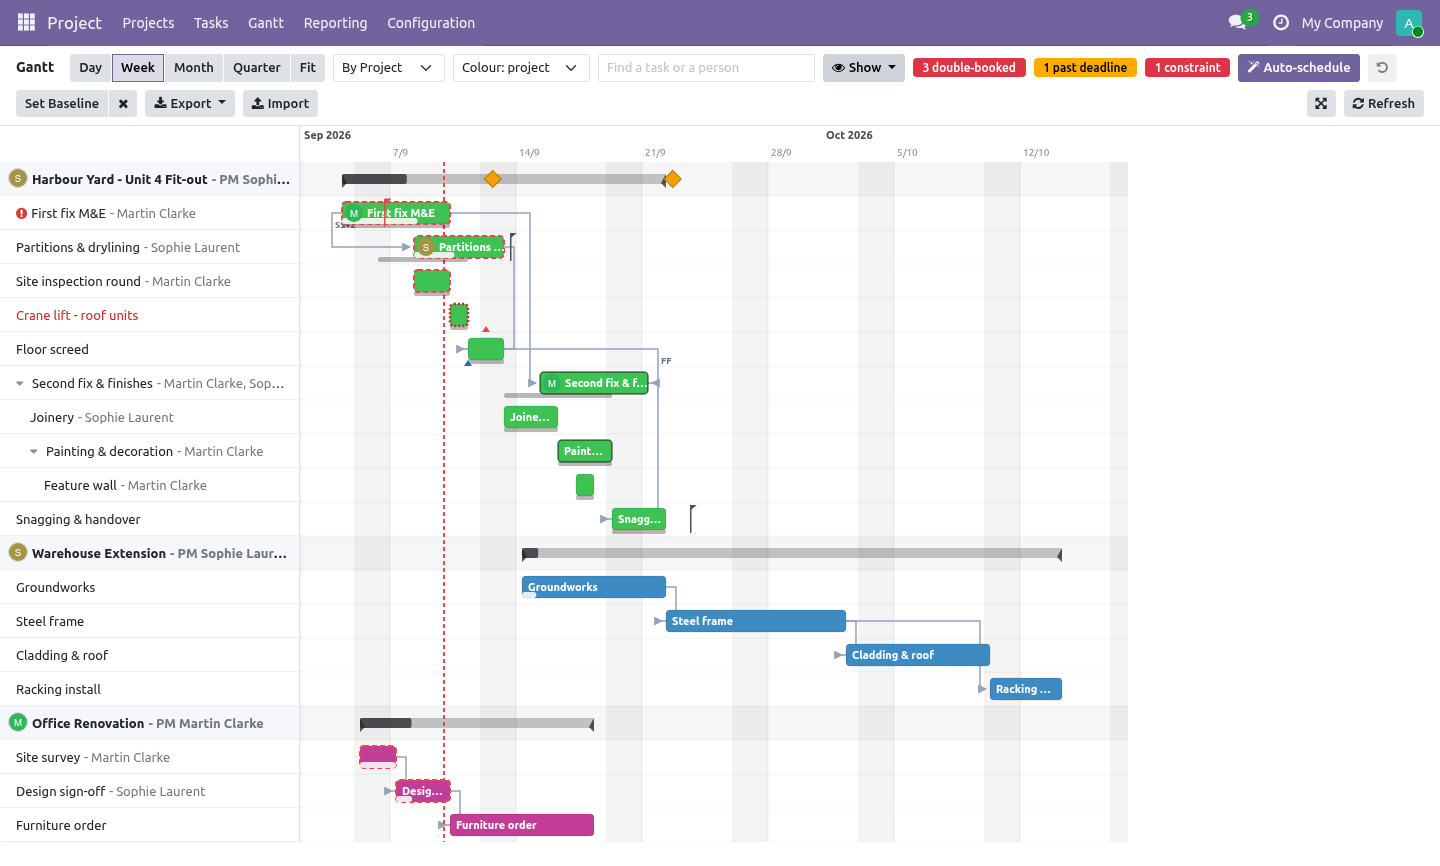
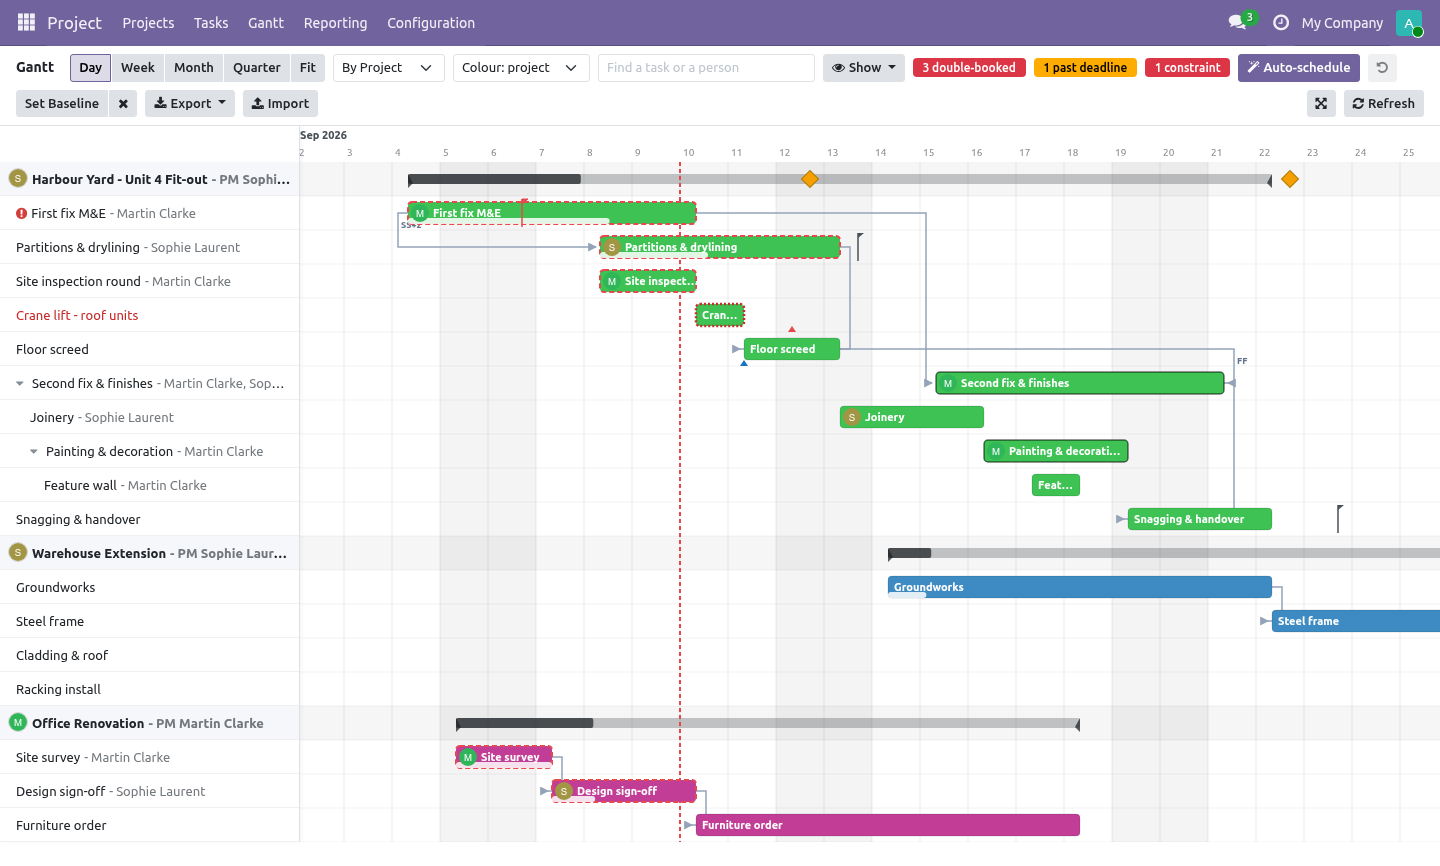
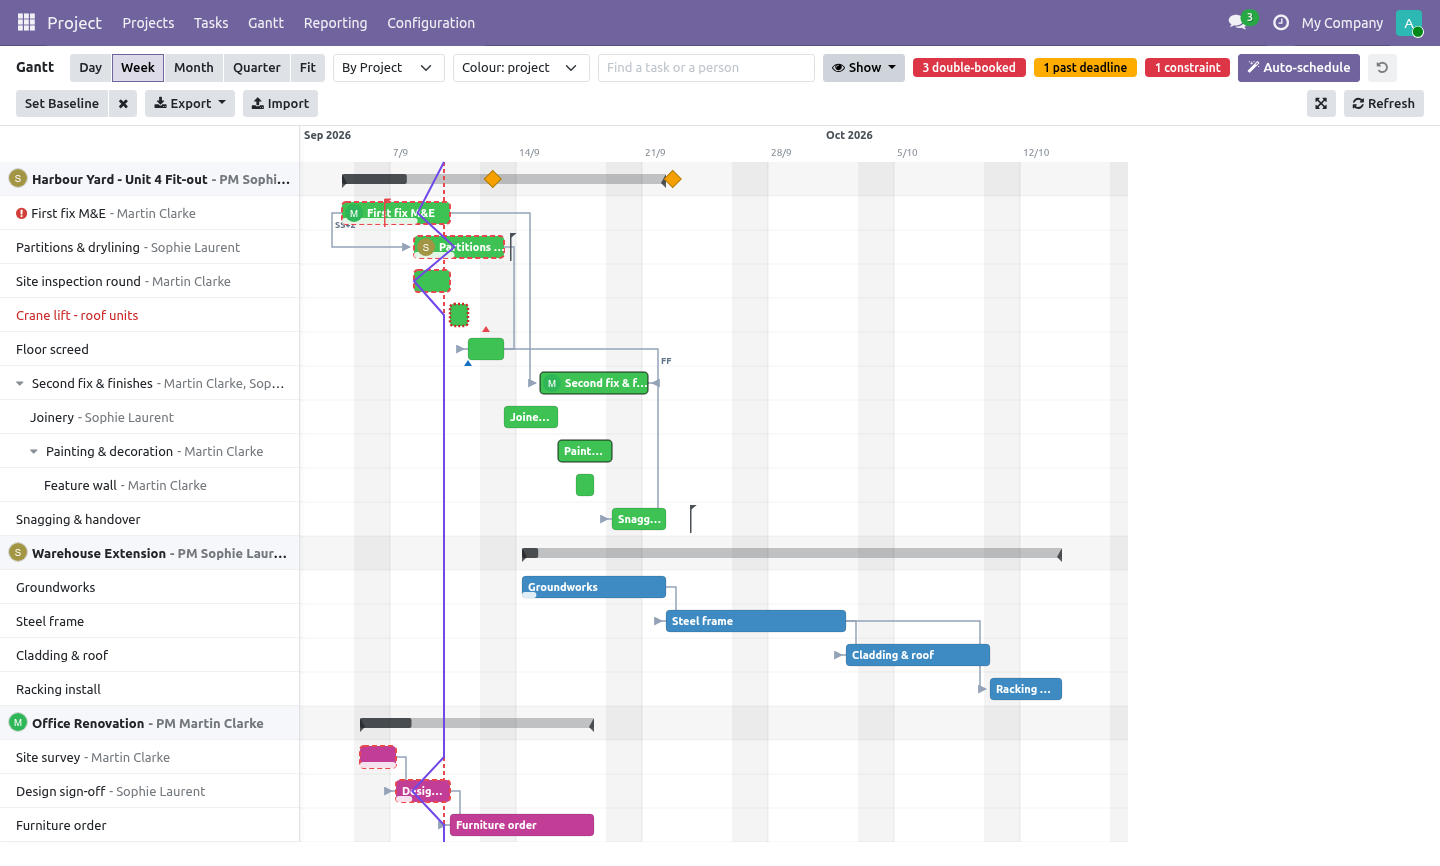
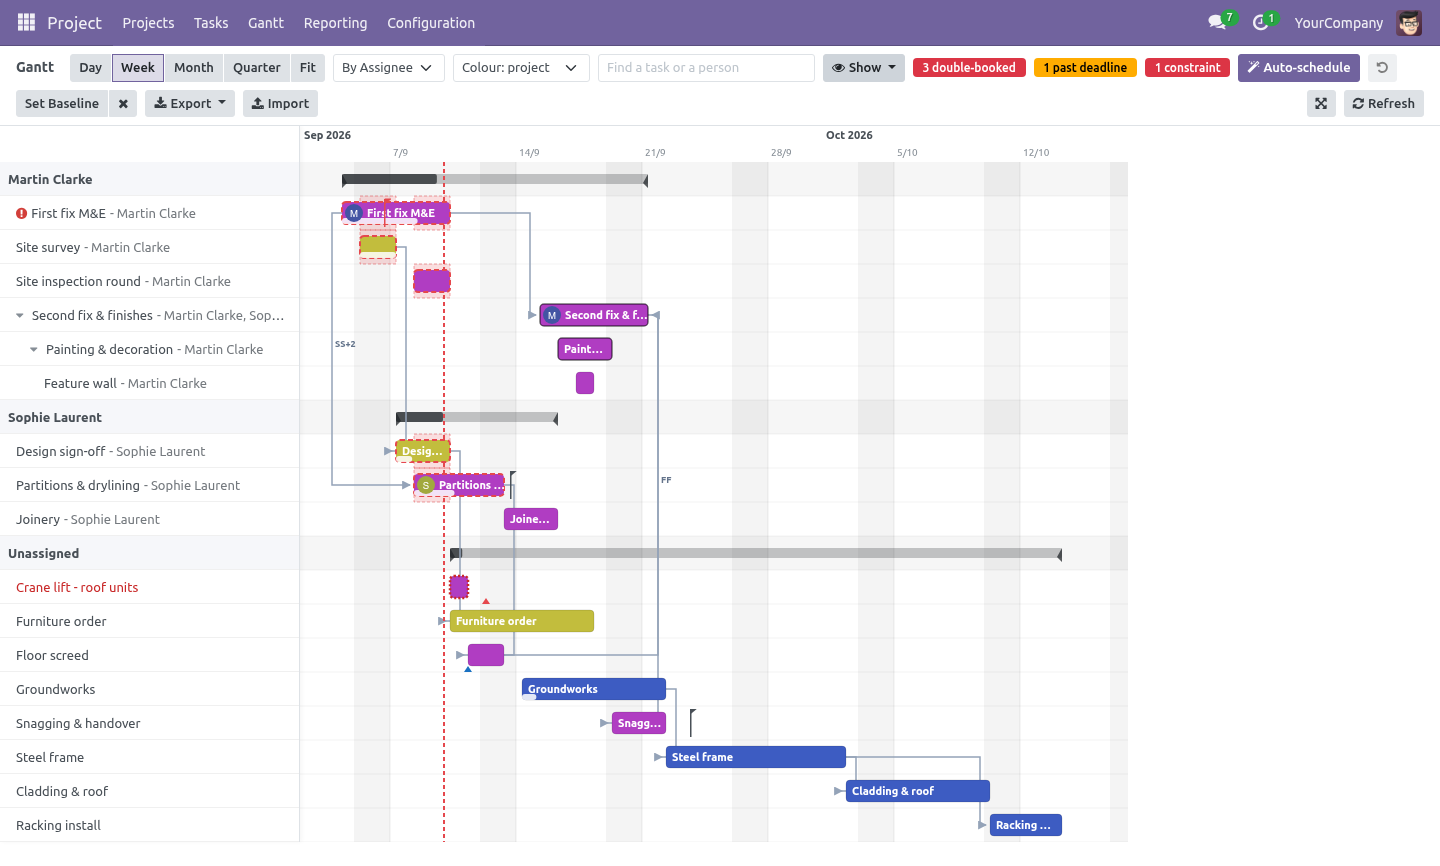
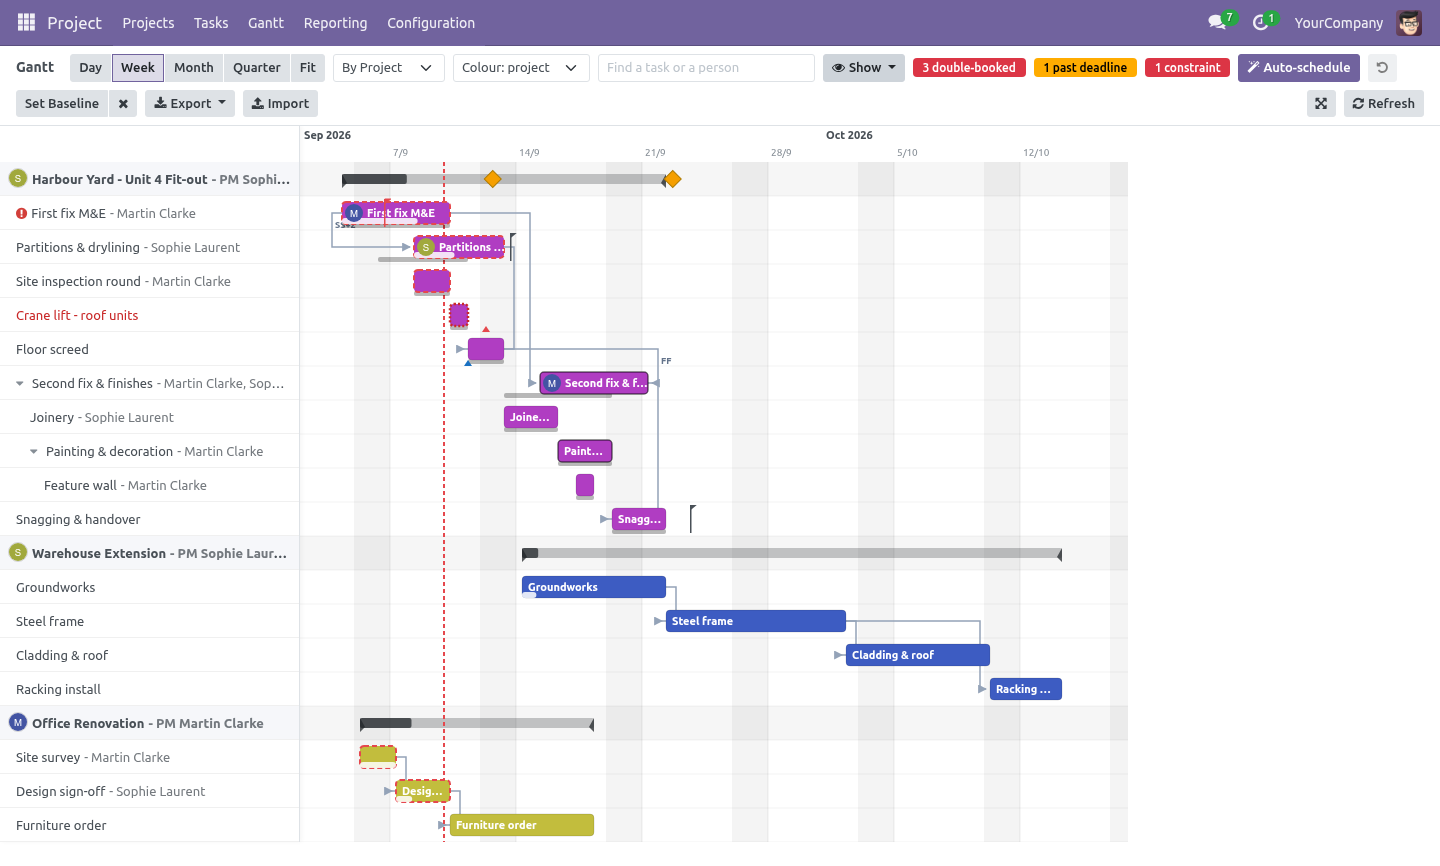
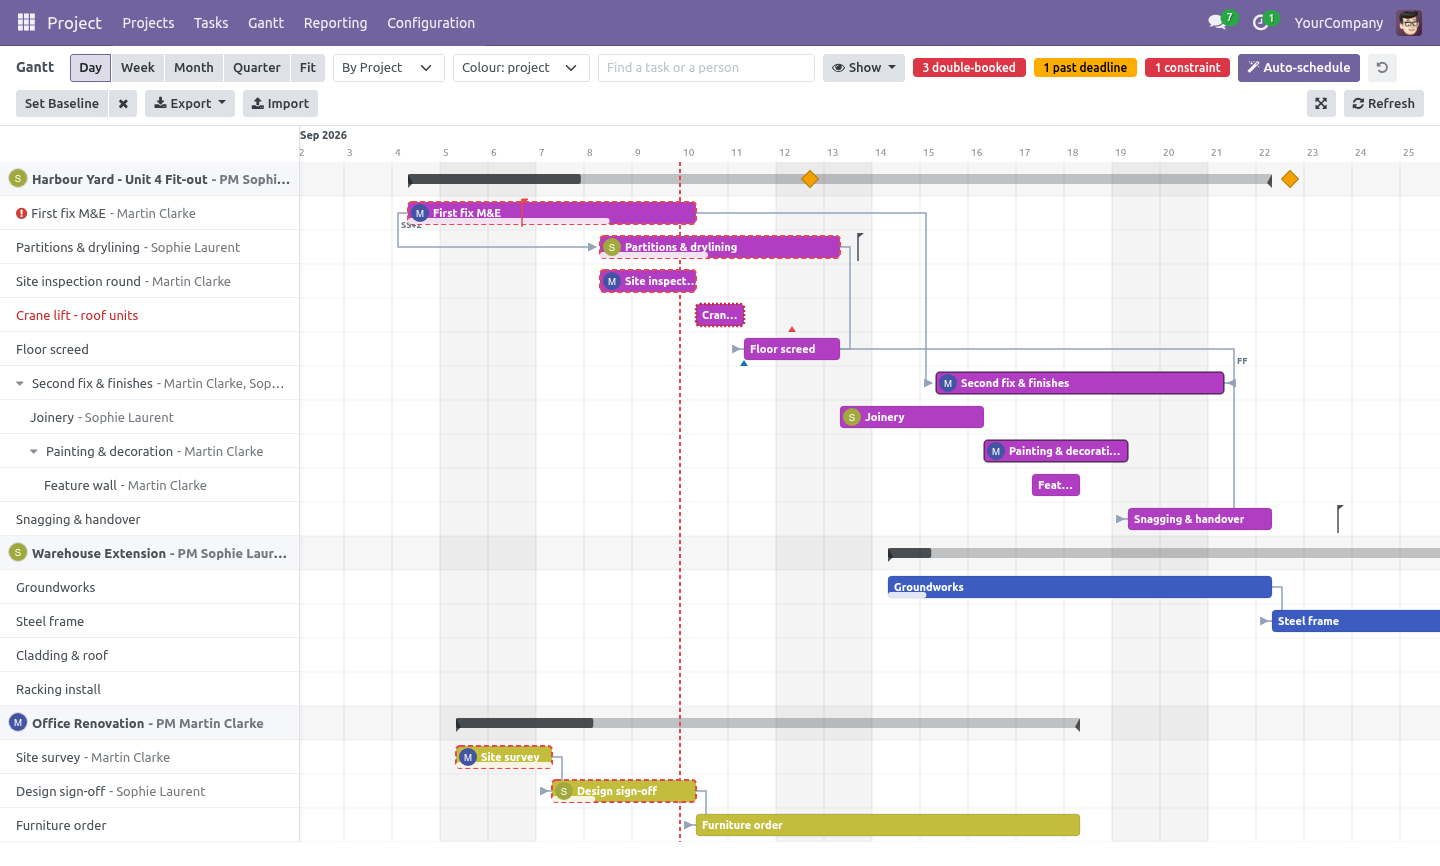
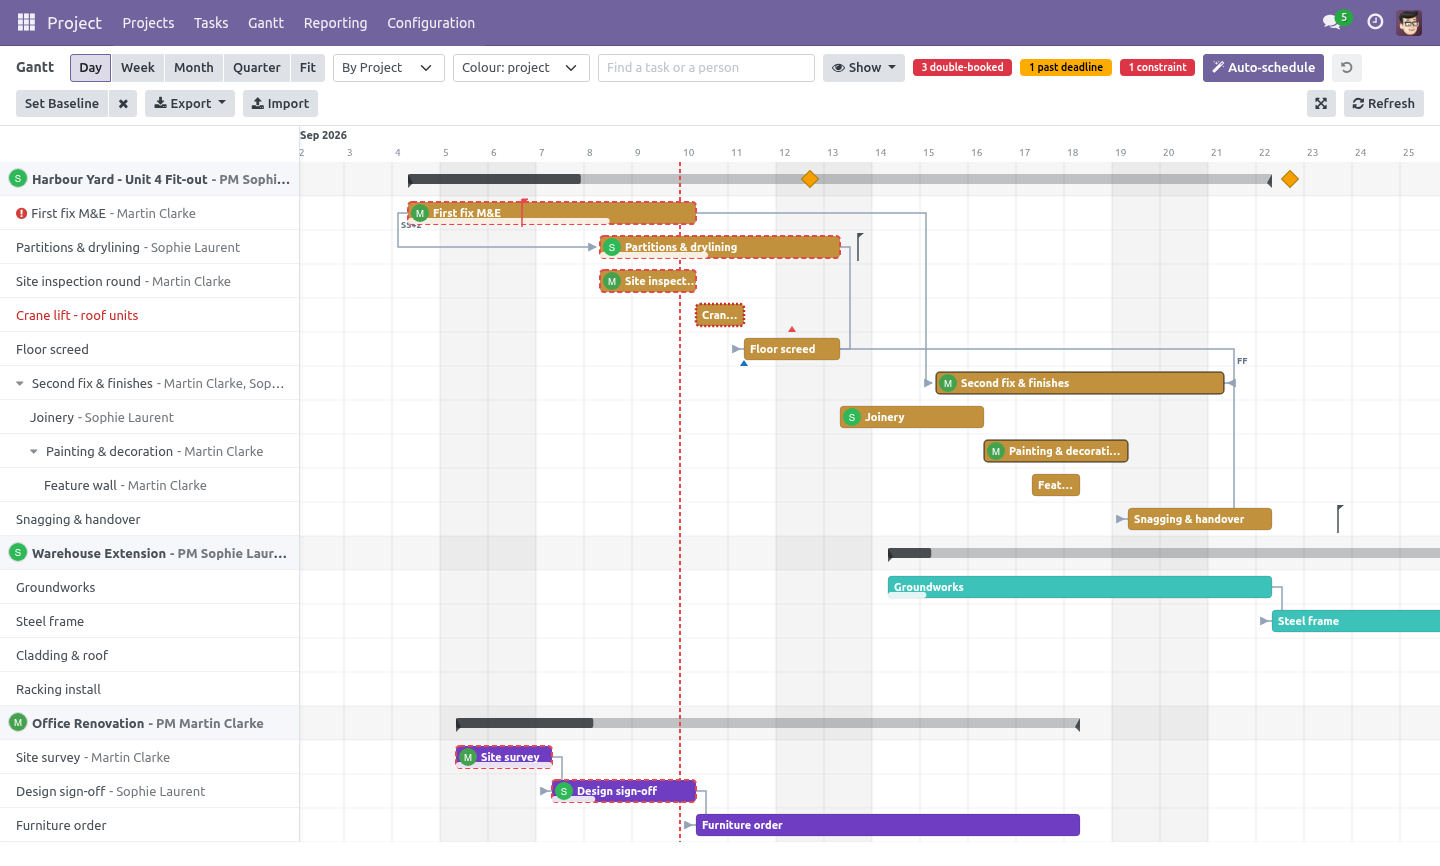
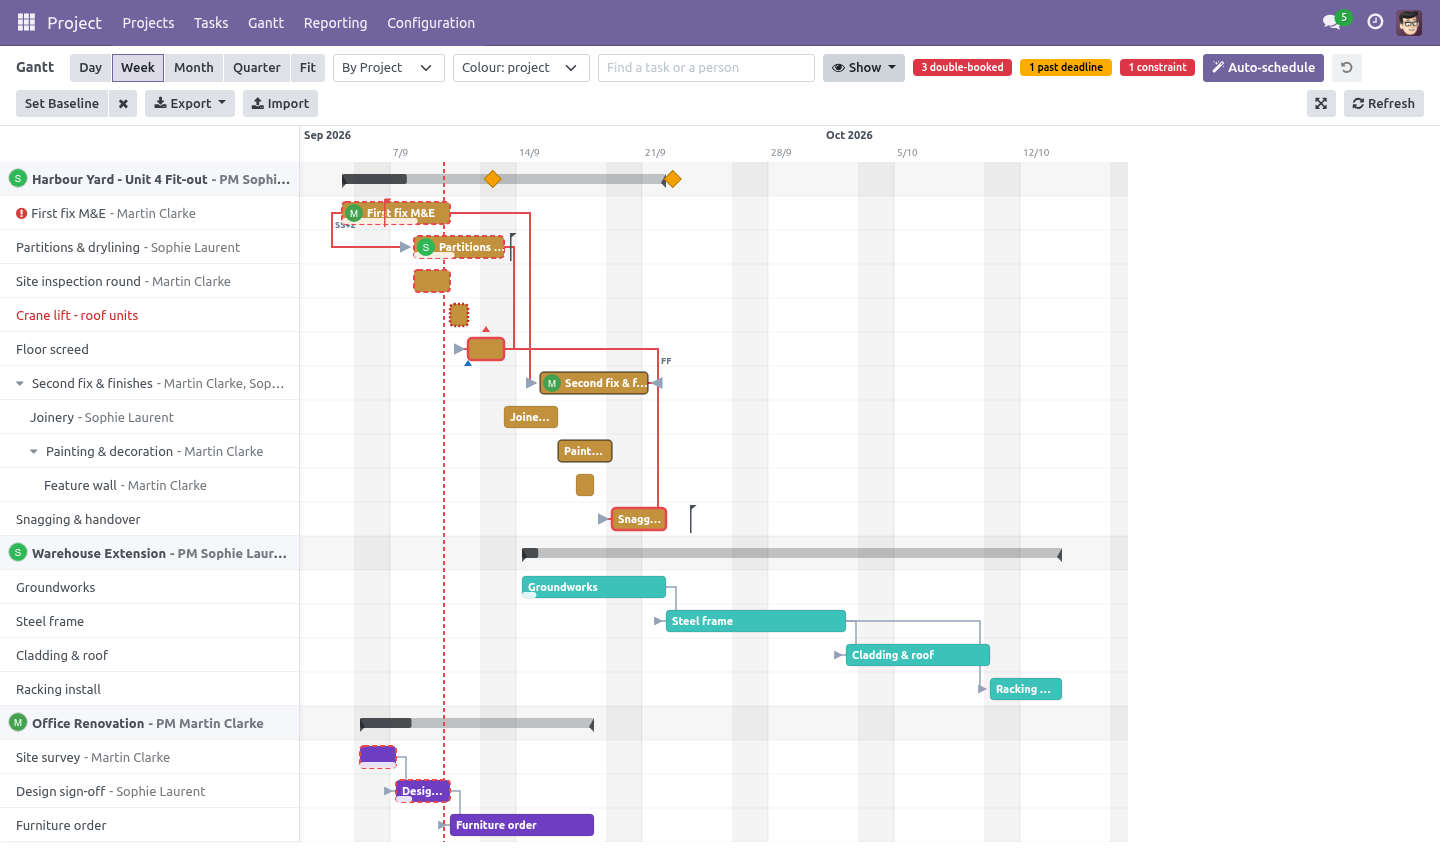
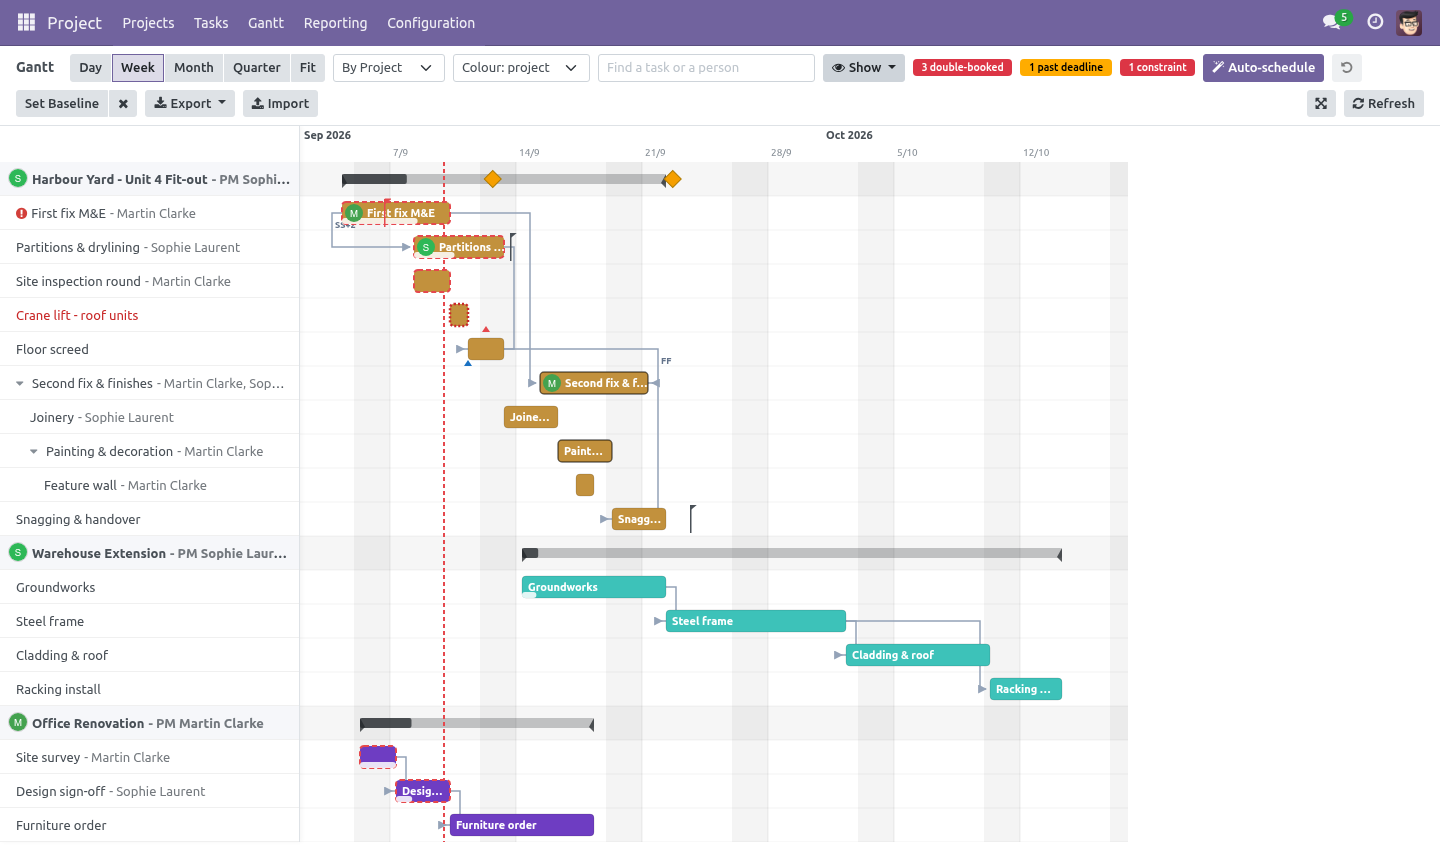
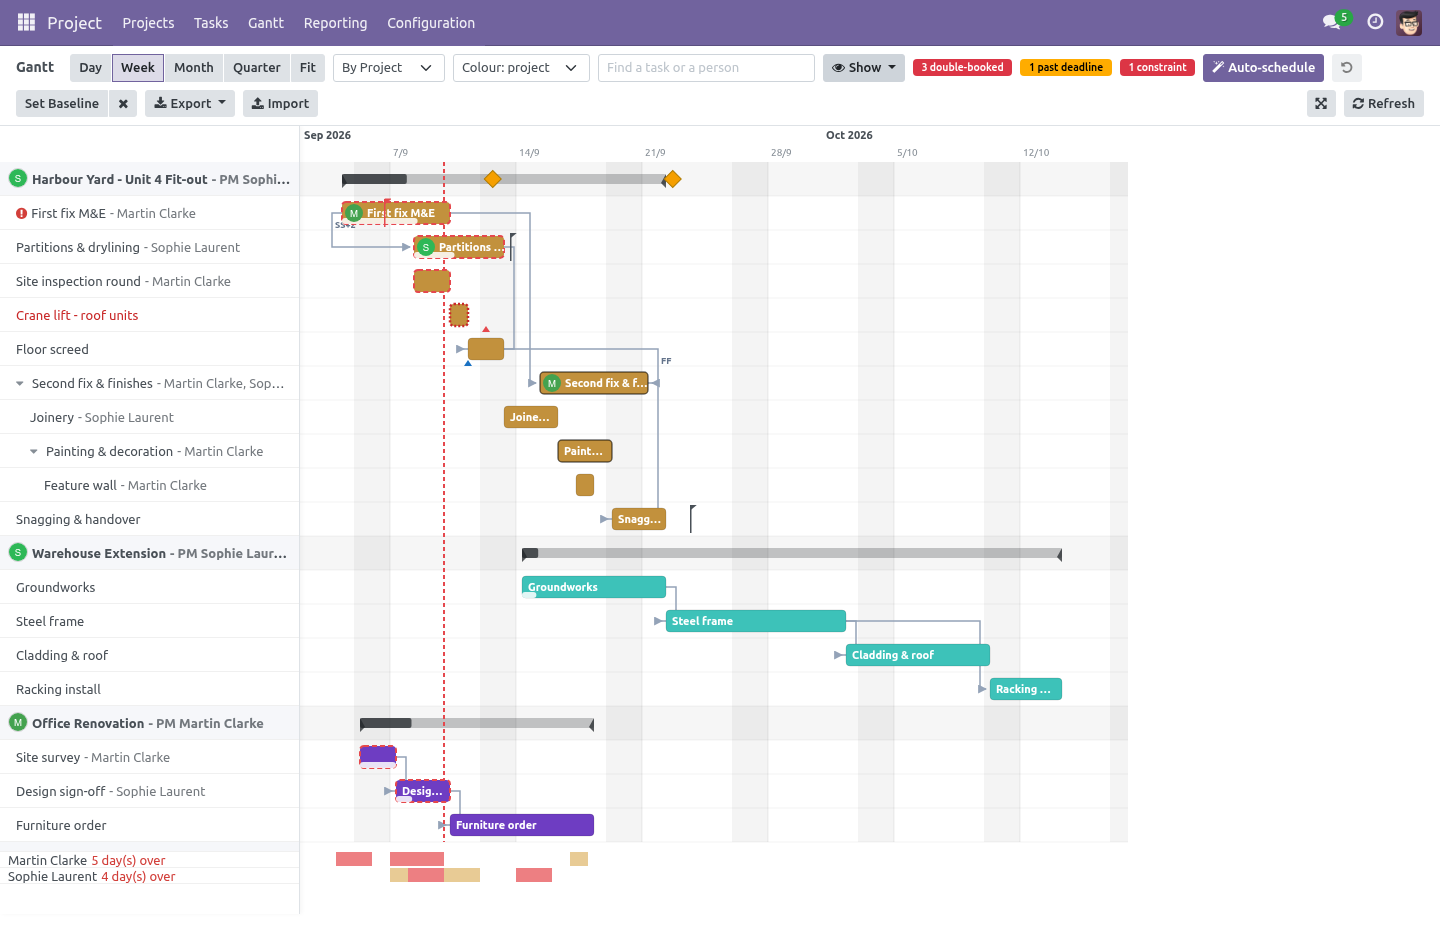
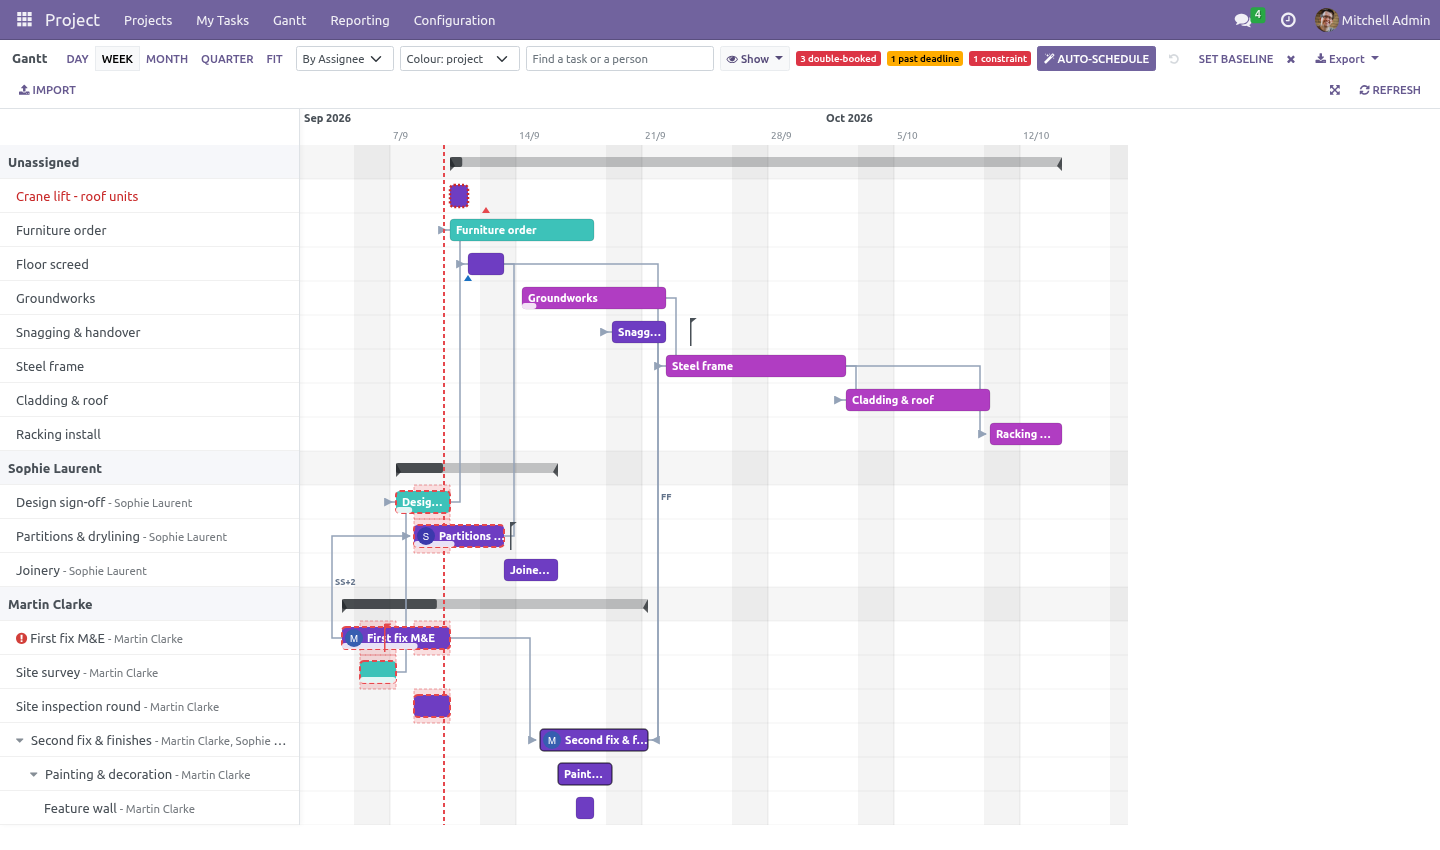
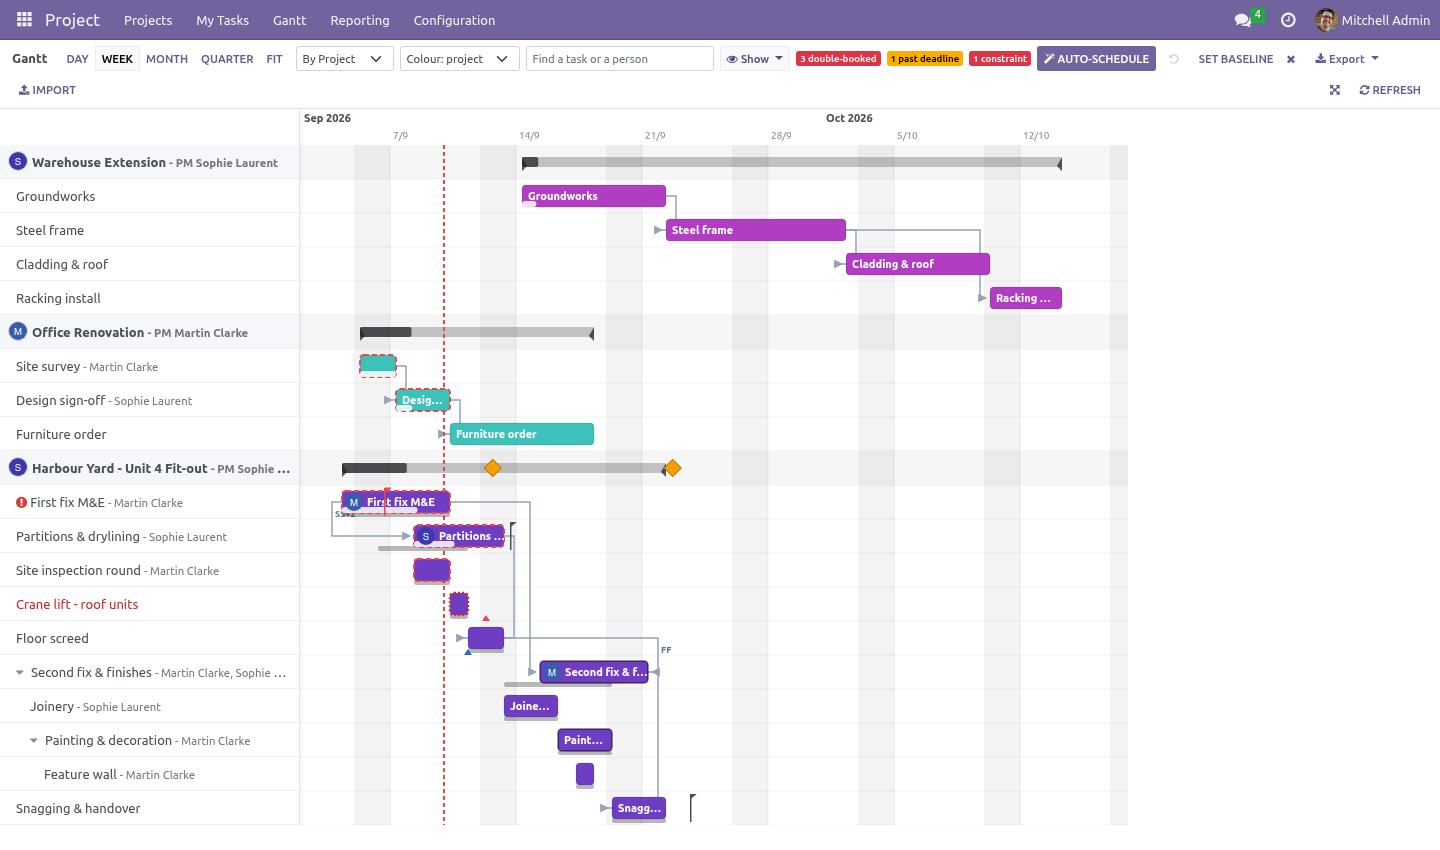
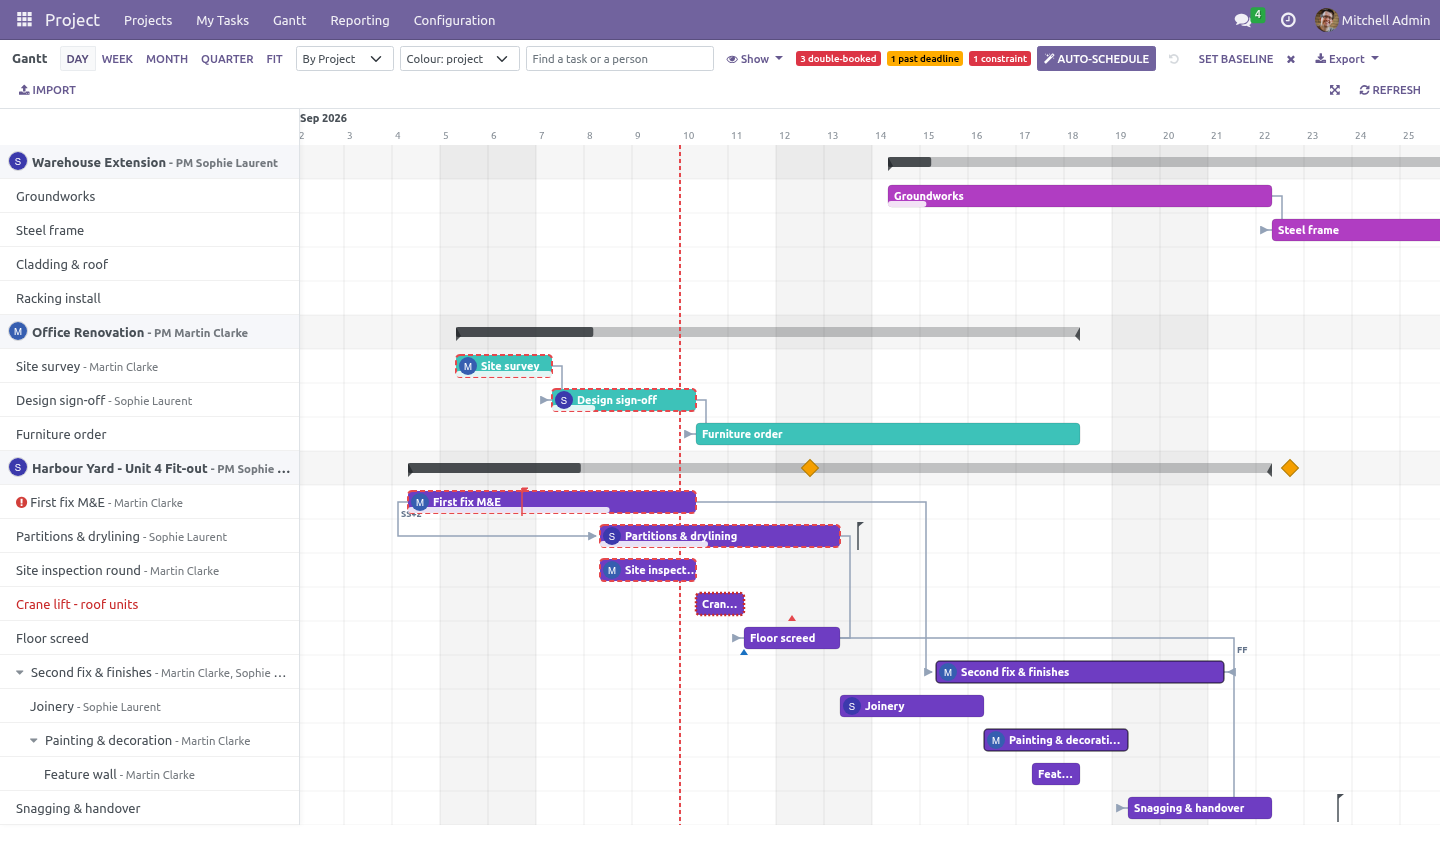
Community Odoo plans projects in lists and kanbans; the schedule lives in somebody's head. This app draws it — and lets you drag it. What you get A Gantt timeline over your existing tasks: one bar per task, grouped by project or by assignee, zoomed by day, week, month or quarter - or Fit, which sizes the whole plan to the window - with weekend shading and a dashed today line. The chart opens scrolled to today.
Drag to reschedule - grab a bar and move it whole days; grab either edge to stretch or shrink it. A plain click opens the task. Undo puts the last move back, successors included. Automatic successor shifting: when a moved task would now overlap a task that depends on it, the dependent is pushed to start where its predecessor ends - keeping its duration - and so on down the chain.
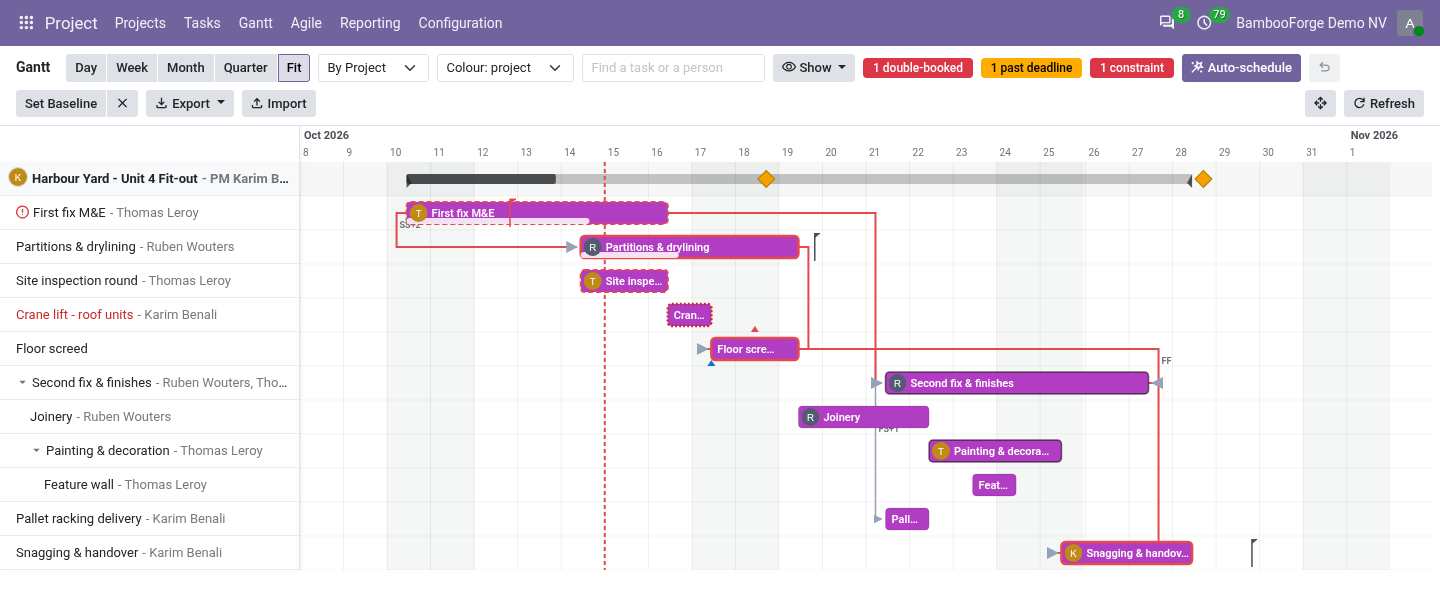
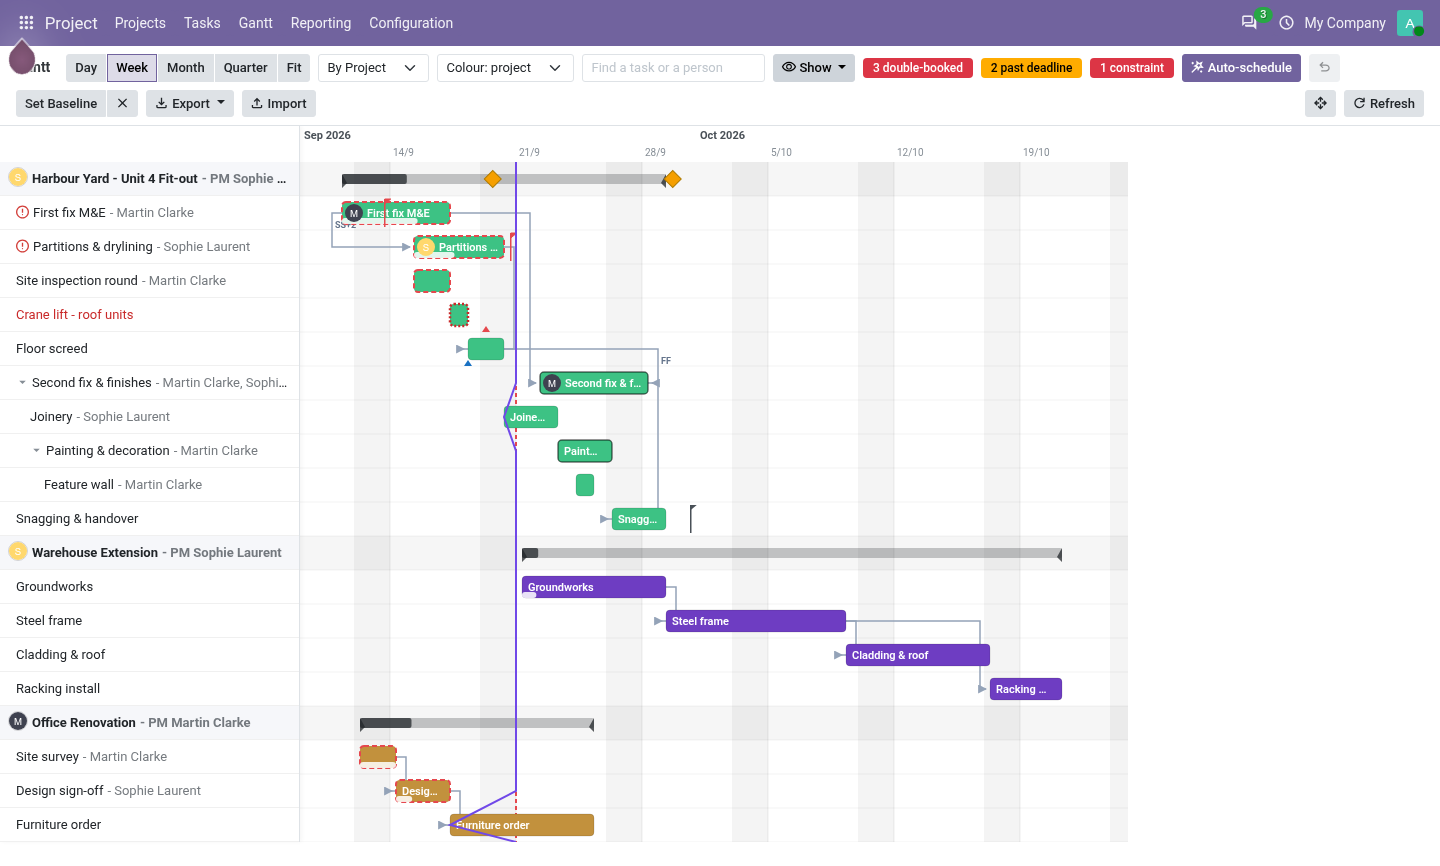
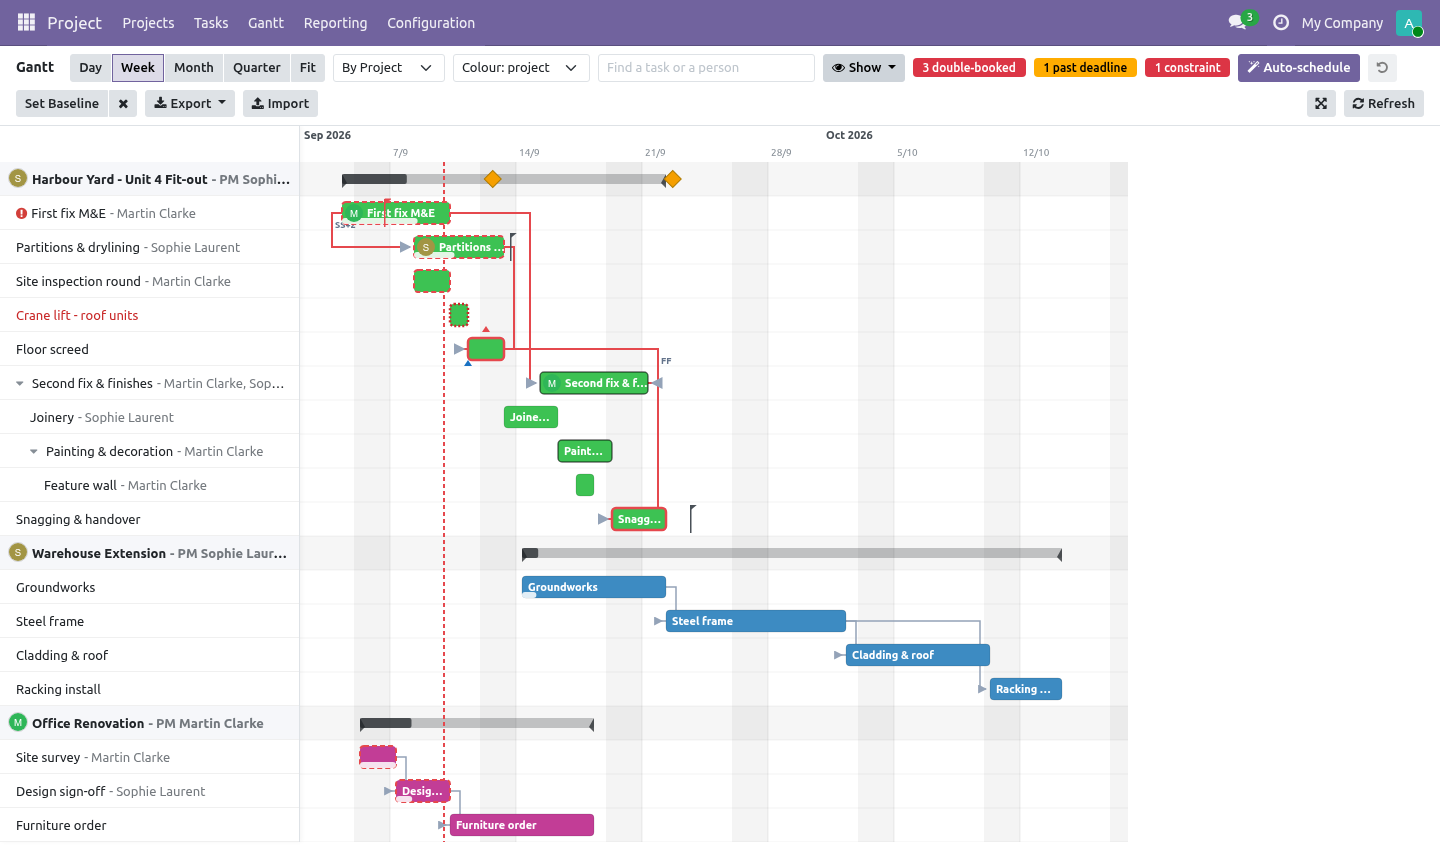
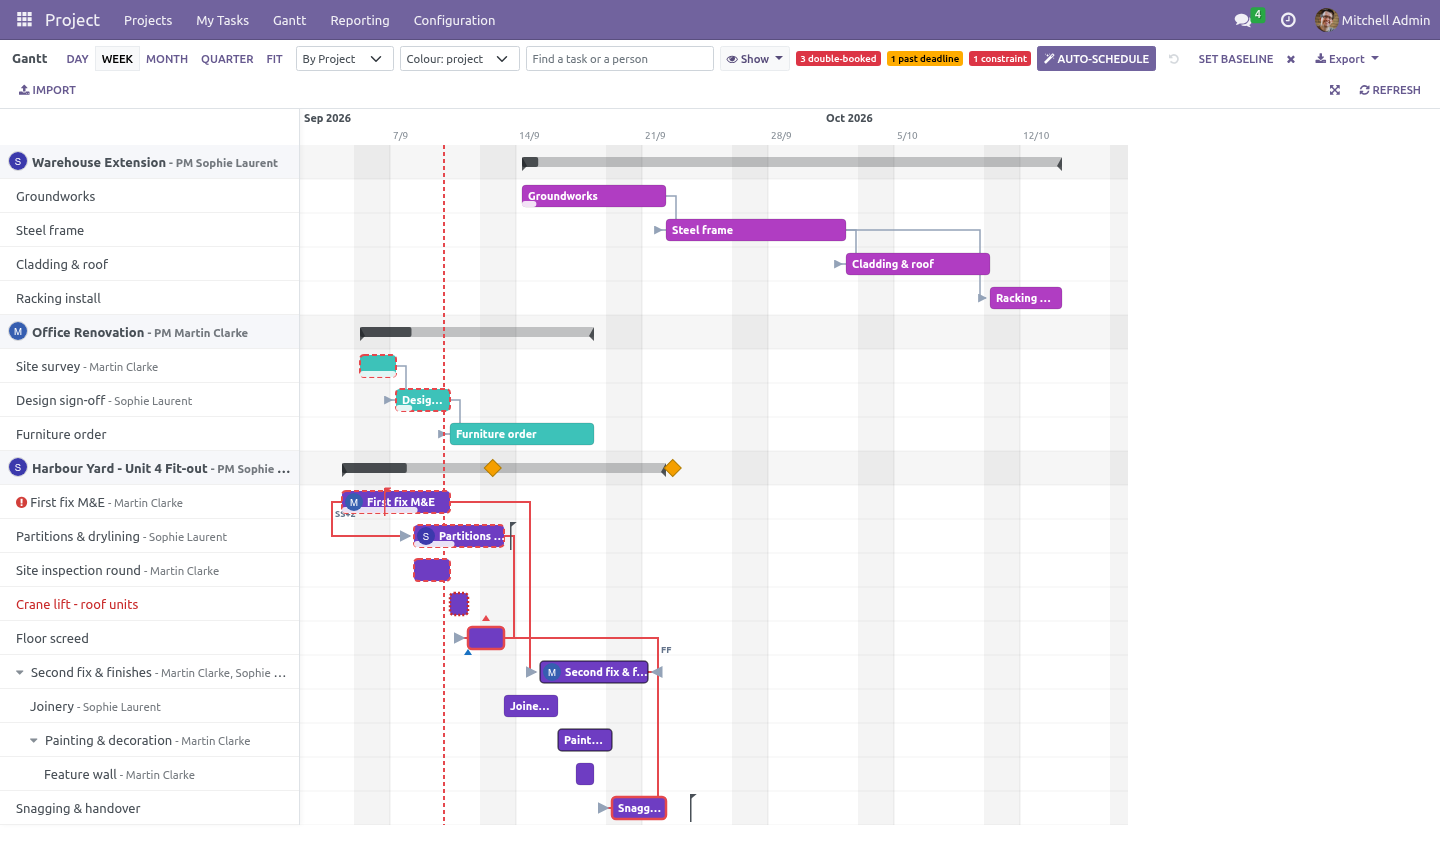
Auto-schedule: one button packs every open task as early as its dependencies, its constraints and the working calendar allow, the way MS Project's automatic mode does. Schedule constraints on a task - Start No Earlier Than, Must Finish On and the rest of the MS Project set - drawn as a pin under the bar, red when the bar breaks them. Dependency arrows drawn from Odoo's own task dependencies, typed (FS, SS, FF, SF) with a lag; draw a new one by dragging the handle at the end of a bar onto another bar, click an arrow to remove it. Critical path and float: the chain that decides the end date turns red; every other task's tooltip says how many days it can slip.
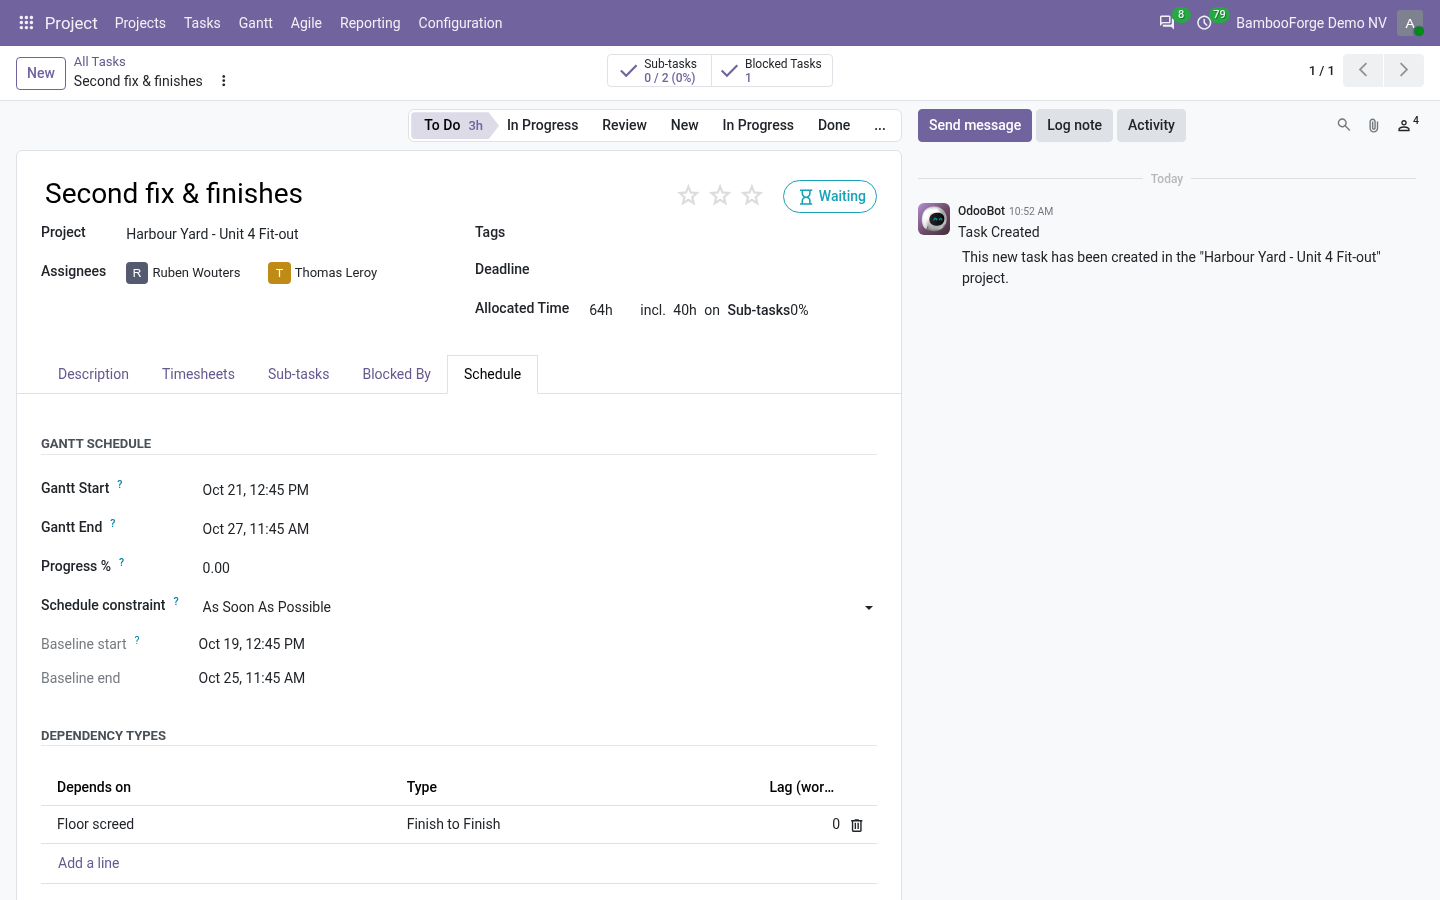
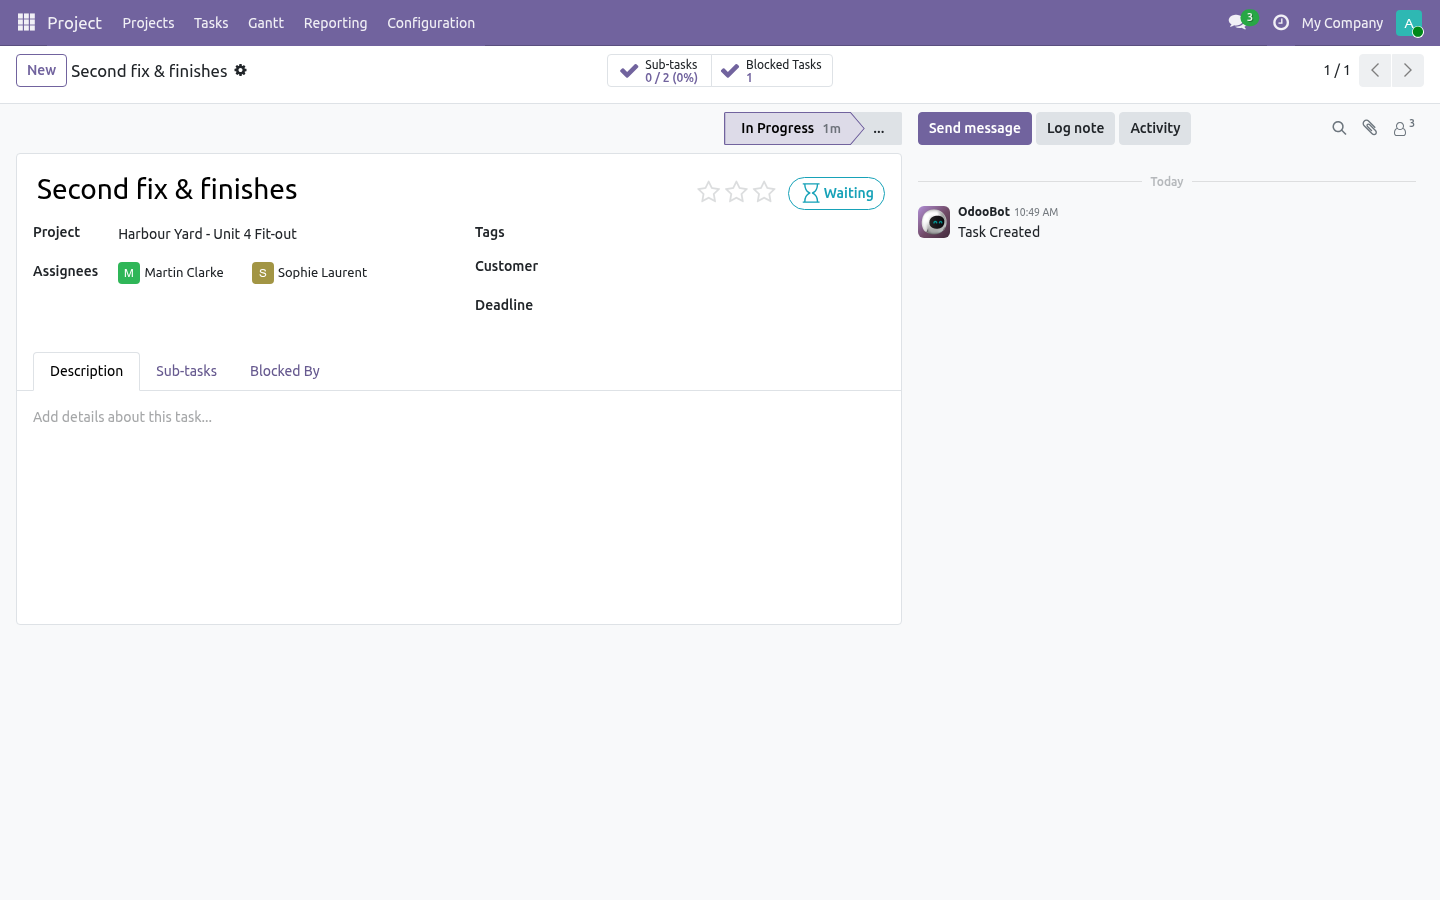
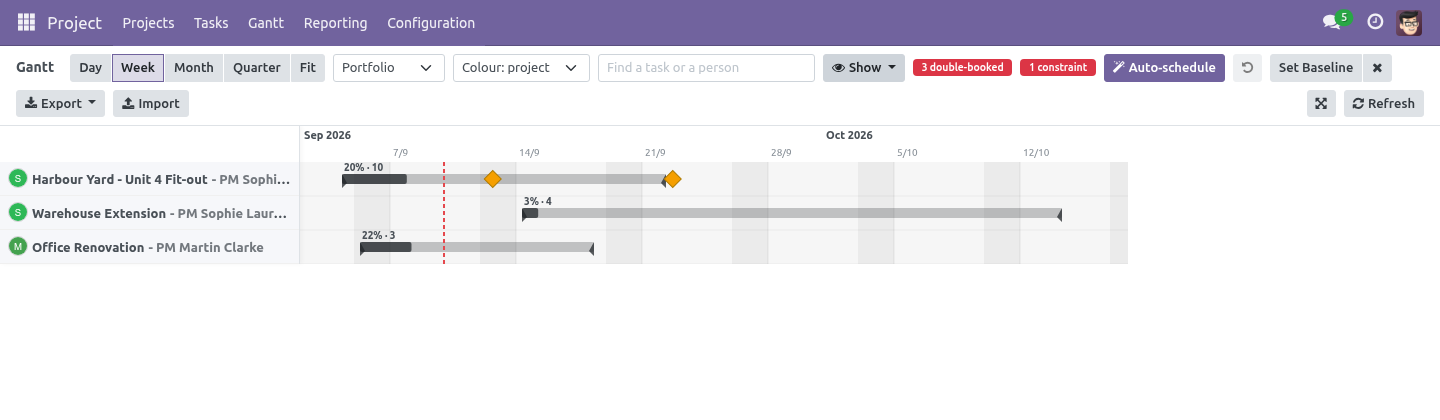
Subtasks nested under their parent at any depth, folded with a caret; summary bars on every project row; a Portfolio view with one bar per project. Where the dates come from. The chart draws its own pair of fields — Gantt Start and Gantt End on the task (visible under Extra Info → Gantt Schedule). They are deliberately separate from the deadline: re-planning the schedule does not silently move the commitment you gave the customer.
Start: the assignment date, else the creation date — at 08:00. Length: the allocated hours at 8 h/day; else up to the deadline; else three days. The first time a task appears on the chart with no schedule, it gets a sensible one: Moving tasks Drag the bar to move it, whole days at a time (the time of day is kept, so a task that starts at 08:00 keeps starting at 08:00). Drag an edge to change the duration.
Undo (the arrow next to Auto-schedule) restores the bars of the task you moved and of everything the move pushed. Thirty steps deep. Dependency cycles (possible via imports) are detected: the shift stops instead of looping forever, and the critical path is simply not shown. Constraints and the automatic scheduler.
A task carries a schedule constraint (Extra Info → Gantt Schedule): As Soon As Possible - the default; the scheduler may put it anywhere its predecessors allow. Start No Earlier Than / Finish No Earlier Than - a fence: the scheduler will not pull it before the date. Start No Later Than / Finish No Later Than - a deadline for the scheduler: it cannot force it, but it reports the breach. Must Start On / Must Finish On - pinned.
The bar goes on the date even if a predecessor ends after it, and the chart shows the clash. A constraint is drawn as a small pin under the bar (blue; red when the bar breaks it), the row label turns red, the toolbar counts the breaches, and the tooltip states the rule. Links drawn on the chart. Hover a bar: a small circle appears at its end.
Drag it onto another bar and that task now depends on this one (finish-to-start; open the task to change the type or add a lag). A link that would make a loop is refused with both task names in the message. Click an arrow and confirm to remove the dependency - the typed row and Odoo's own link go together. Subtasks and the portfolio.
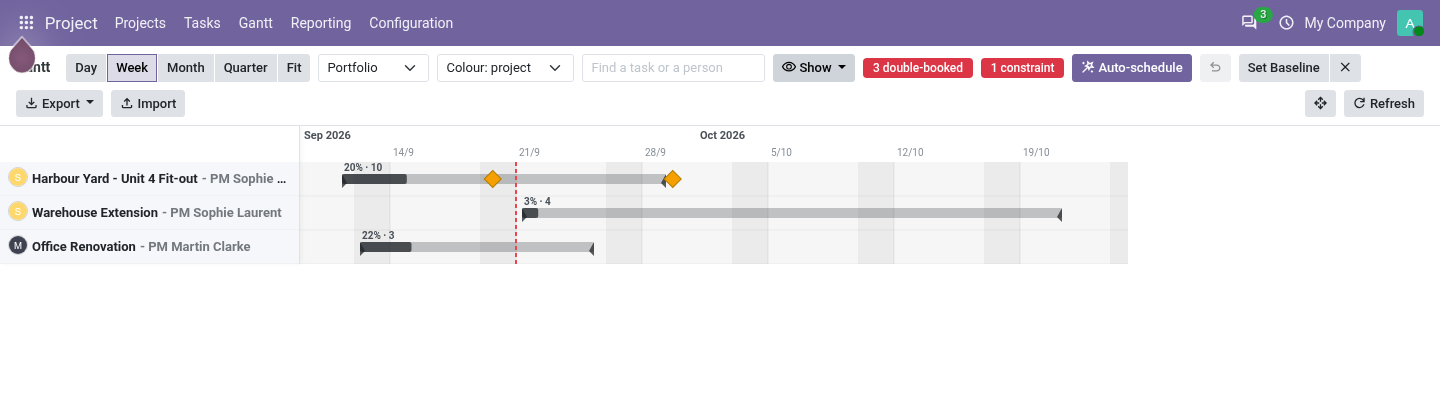
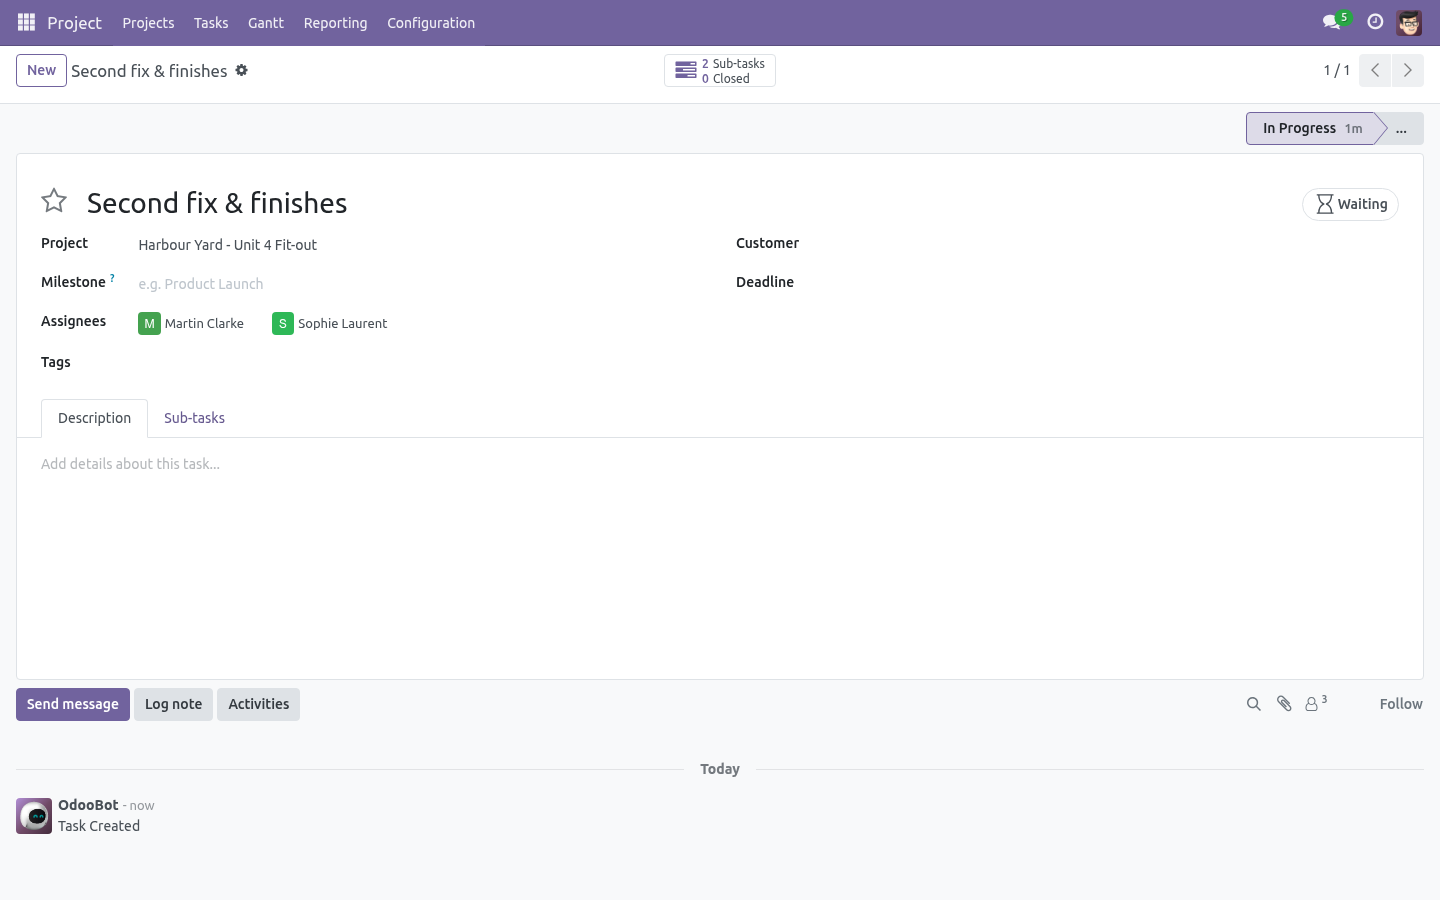
Sub-tasks sit under their parent, indented, at any depth; the caret in the row label folds them. A parent's bar keeps a darker outline; its own dates stay its own - the chart does not roll children up into the parent, because a parent whose dates are computed cannot be planned. Every project row carries a summary bar: earliest start to latest end of its tasks, the done part filled, progress weighted by duration. Switch the grouping to Portfolio and only those rows remain - every project on one timeline, a percentage next to each - and a click on a summary opens that project's own chart.
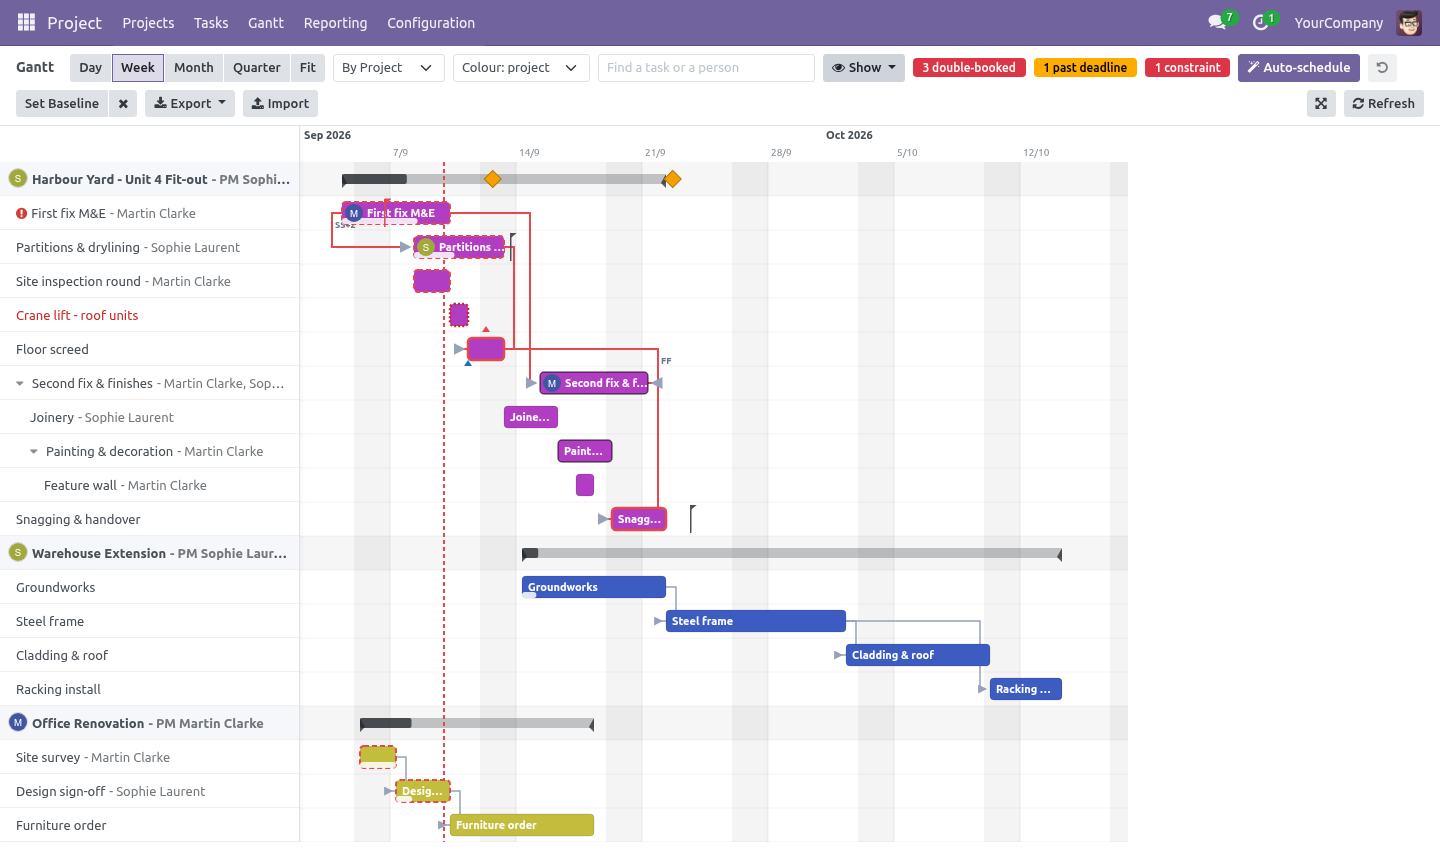
Critical path and float. Tick Critical path and the chain of dependent tasks with the largest total duration turns red - bars and arrows. That chain decides the project end date: shorten anything on it and the project ends earlier; shorten anything off it and nothing happens. The computation runs server-side on the tasks currently displayed.
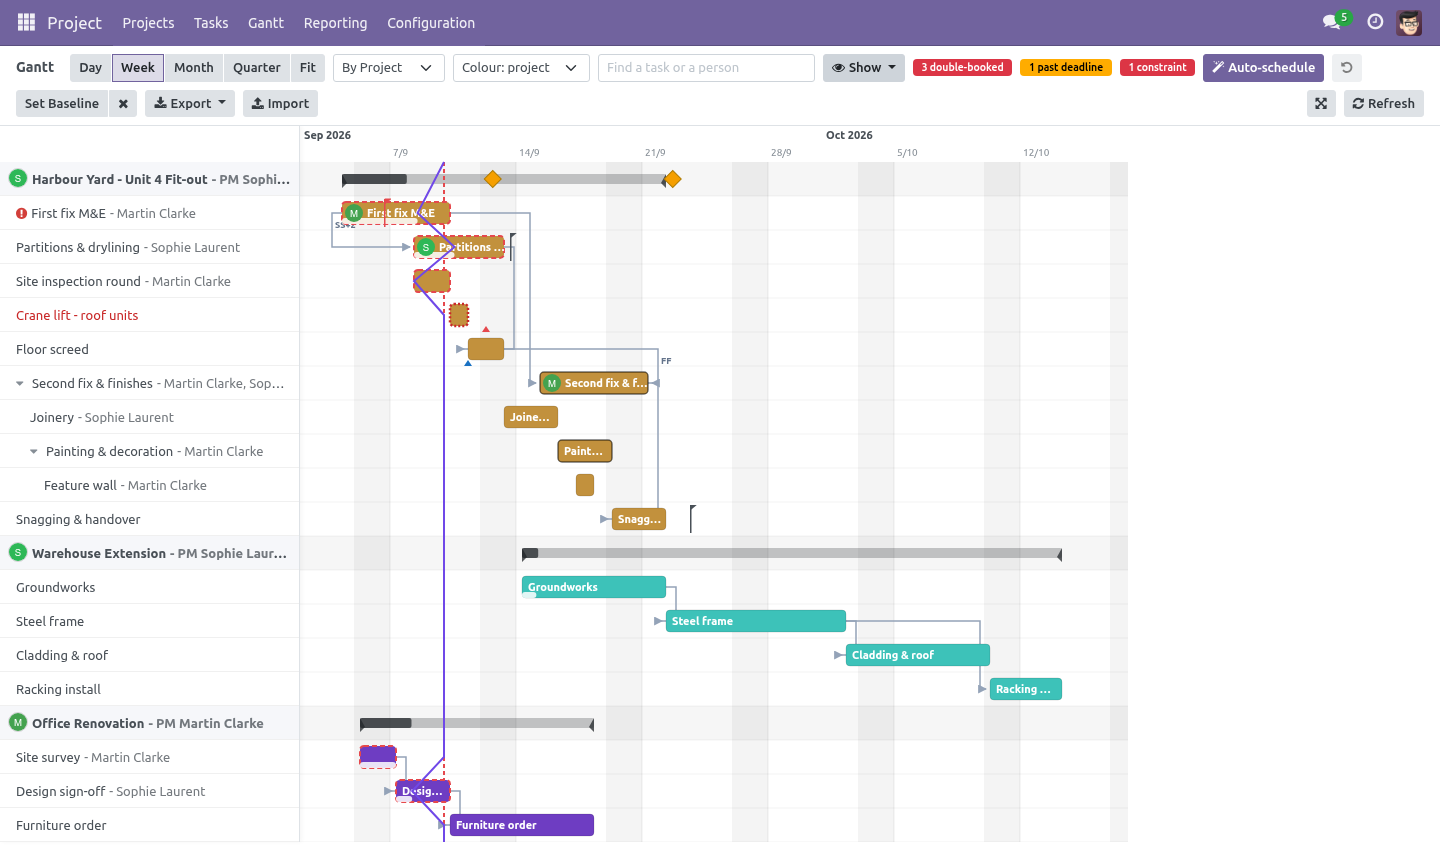
Every linked task's tooltip also states its float: the days it can slip before the end date moves, from the classic forward and backward pass over durations and lags. Zero float is the critical path. Progress line and deadlines. Tick Progress line and a line runs down from today, bending left to every bar whose progress strip has not reached today (behind) and right to every bar that is ahead.
It is the one picture a steering meeting needs. A task's deadline is a flag on its bar; it turns red once the bar ends after the deadline or the deadline has passed with the task open, the row label gets a warning mark and the toolbar counts them. Colour the bars by deadline to see green (time left), amber (three days or fewer) and red (missed) across the whole plan. Workload in hours.
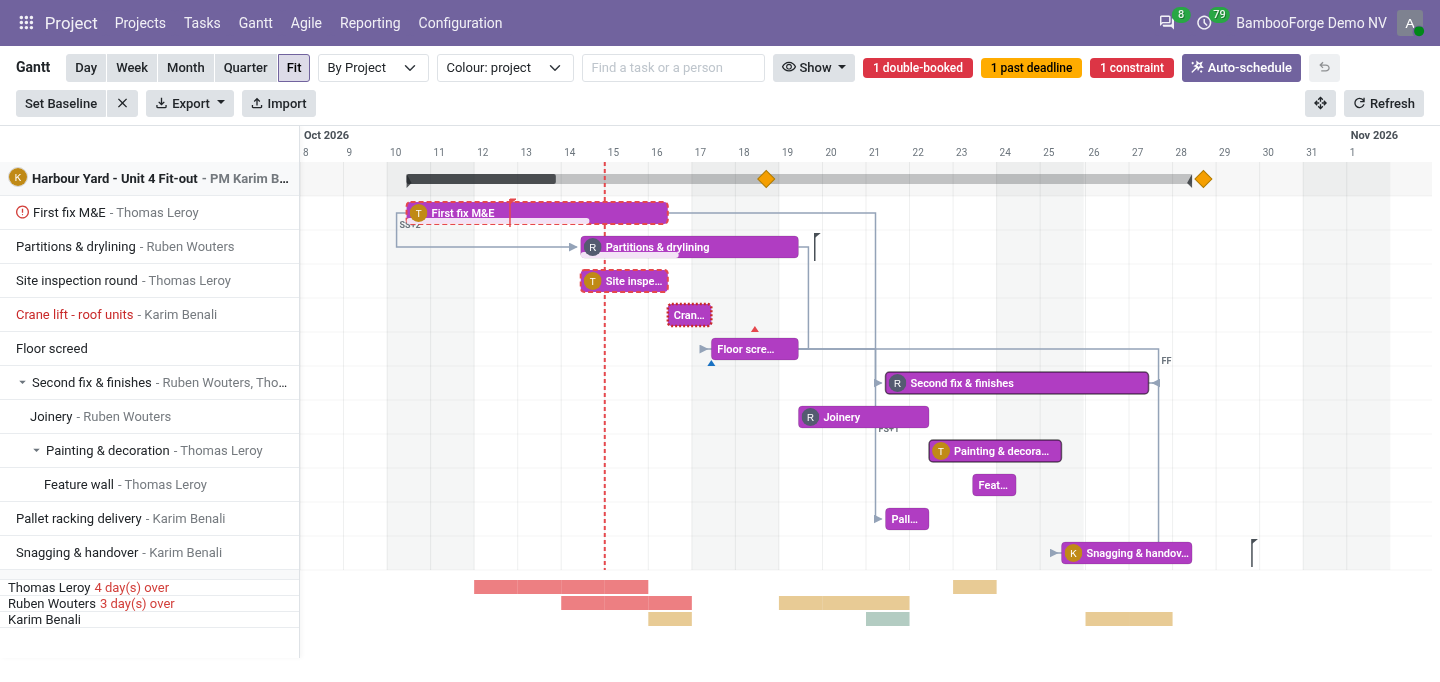
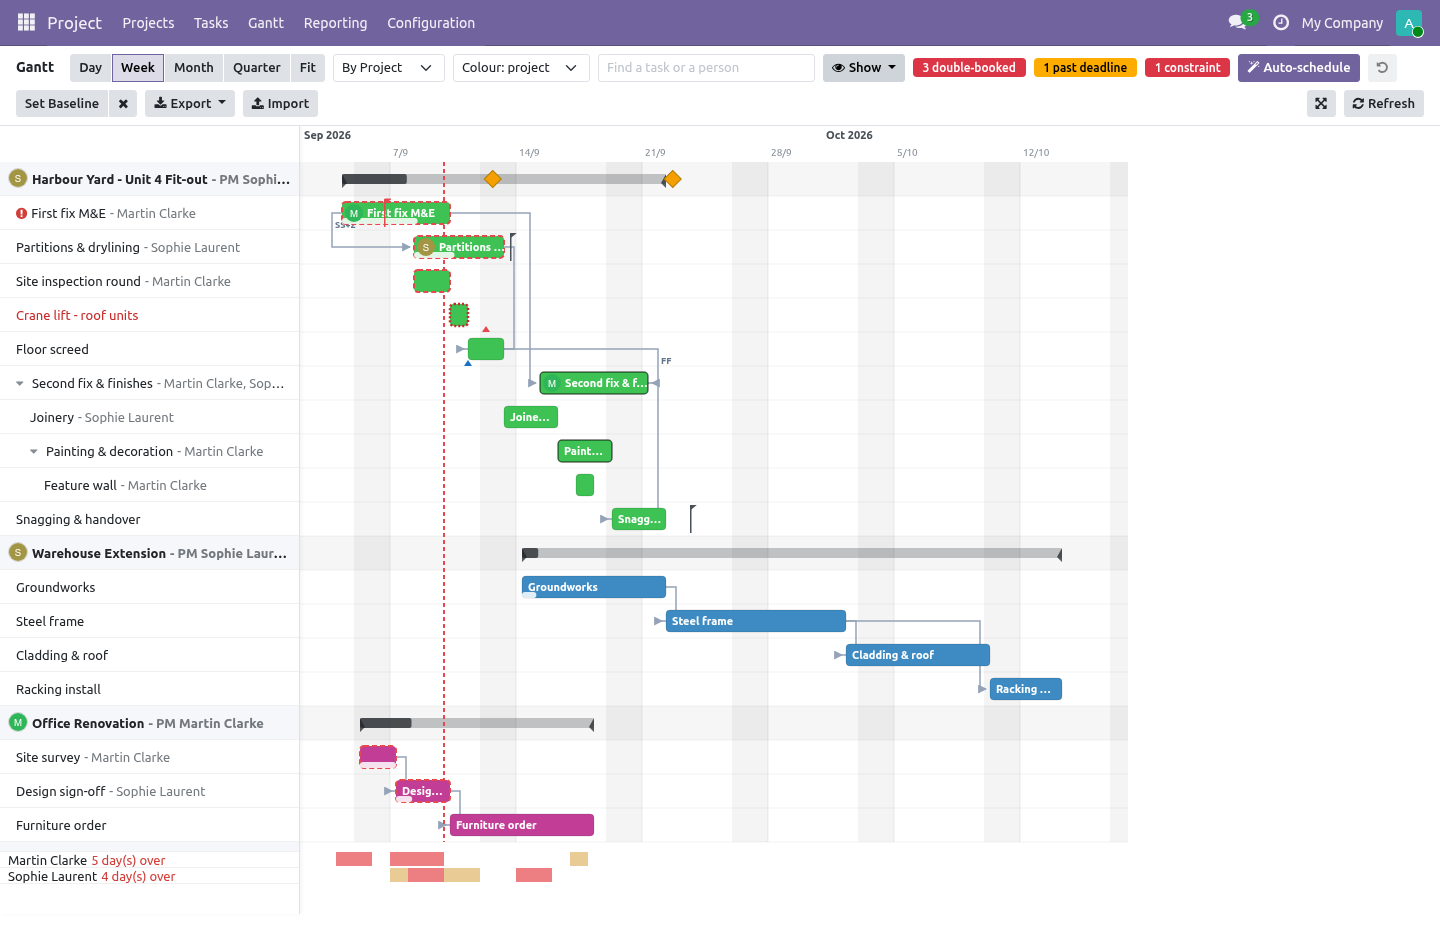
Tick Workload and one row per person appears under the chart, one cell per day. A task's hours (its allocated hours, else eight for every working day it covers) are spread evenly over the working days it spans and over its assignees; the cell compares that with the hours the company calendar gives that day. Light green is half a day or less, amber a full day, red more than the day has - and the row label counts the days a person is over. Now the part most videos leave out: what this does not do.
Bars snap to whole days; this is a planning chart, not a time clock. The scheduler is a forward pass: it packs early and never levels resources. Two people over capacity are shown in red, not fixed. The critical path and float weigh each bar by its length in days and do not model resource contention.
Progress is a manual percentage - honest and simple; it does not try to guess from timesheets. The complete manual is at docs dot bambooforge dot dev, the demo database is linked from the store page, and support answers within twenty-four hours. Links are in the description.
Transcript of the walkthrough (Odoo 19)
Gantt View for Projects. A real Gantt chart for Odoo Community: drag to reschedule, dependency arrows, automatic successor shifting, critical path and milestones. Community Odoo plans projects in lists and kanbans; the schedule lives in somebody's head. This app draws it — and lets you drag it.
In the next few minutes: gantt view for projects, then what you get, then where the dates come from, then moving tasks, then critical path. Then what this app deliberately does not do, so you can tell before you buy whether it fits. Everything lives under Gantt. 1.
Install BambooForge Project Gantt (depends on Project only). 2. A Gantt menu appears in the Project app, and every project form gets a Gantt smart button scoped to that project. 3.
To see dependency arrows, enable Task Dependencies on the project. Gantt View for Projects. Community Odoo plans projects in lists and kanbans; the schedule lives in somebody's head. This app draws it — and lets you drag it.
What you get A Gantt timeline over your existing tasks: one bar per task, grouped by project or by assignee, zoomed by day, week or month, with weekend shading and a dashed today line. The chart opens scrolled to today, not to the oldest task in history. Drag to reschedule — grab a bar and move it whole days; grab either edge to stretch or shrink it. A plain click opens the task.
Automatic successor shifting: when a moved task would now overlap a task that depends on it, the dependent is pushed to start where its predecessor ends — keeping its duration — and so on down the chain. Everything that moved is written in one call. Dependency arrows drawn from Odoo's own task dependencies (Settings → Task Dependencies on the project). Critical path — one checkbox highlights the chain of dependent tasks with the largest total duration: the tasks that decide the end date.
Milestones as diamonds on the project row (green once reached). A progress strip inside each bar, set from the task form. Built from scratch in OWL and SVG. No bundled Bryntum/dhtmlx builds, no extra JavaScript licence, nothing phoning home.
Where the dates come from. The chart draws its own pair of fields — Gantt Start and Gantt End on the task (visible under Extra Info → Gantt Schedule). They are deliberately separate from the deadline: re-planning the schedule does not silently move the commitment you gave the customer. Start: the assignment date, else the creation date — at 08:00.
Length: the allocated hours at 8 h/day; else up to the deadline; else three days. The first time a task appears on the chart with no schedule, it gets a sensible one: Moving tasks Drag the bar to move it, whole days at a time (the time of day is kept, so a task that starts at 08:00 keeps starting at 08:00). Drag an edge to change the duration. If tasks depend on the one you moved and would now overlap it, they are pushed right, keeping their durations, cascading down the dependency chain.
Tasks that already start after their predecessor ends are left alone — a planned gap is your business, not the chart's. Dependency cycles (possible via imports) are detected: the shift stops instead of looping forever, and the critical path is simply not shown. Critical path. Tick Critical path and the chain of dependent tasks with the largest total duration turns red — bars and arrows.
That chain decides the project end date: shorten anything on it and the project ends earlier; shorten anything off it and nothing happens. The computation runs server-side on the tasks currently displayed. What changed in 1.1 People on the chart. The project manager sits on the project row (avatar and name); every bar carries its assignee's avatar.
Double-bookings surface themselves. One person, two open tasks, overlapping days: the bars get a warning stroke, the overlap window is shaded on the assignee lane, the toolbar counts the conflicts and can filter to them - and the tooltip names the colliding task. Working calendars. Durations count working days on the company calendar: bars start on a workday, hour-based lengths skip weekends and closing days, moved or pushed tasks never restart on a holiday, and company closing days are shaded like weekends.
What changed in 1.2 Baseline. One button freezes today's schedule; a toggle draws the frozen bars under the live ones and the tooltip states the slip in days. Re-planning stops erasing the promise it is measured against. Workload heatmap.
A toggle adds one row per person under the chart, one cell per day: green one task, amber two, red three or more - who can take more work is a glance. What changed in 1.3 Export to PNG. One button rasterises the chart, row labels included, for the status report or the site notice board. Support.
support@bambooforge.dev — answered within two business days. This module is licensed OPL-1; one purchase covers one production database plus its staging copies. Now the part most videos leave out: what this does not do. Bars snap to whole days; this is a planning chart, not a time clock.
The schedule follows the company working calendar; the critical path still weighs each bar by its calendar length, and does not model resource contention. Progress is a manual percentage — honest and simple; it does not try to guess from timesheets. Grouping by assignee shows each task under its first assignee. The complete manual is at docs dot bambooforge dot dev, the demo database is linked from the store page, and support answers within twenty-four hours.
Links are in the description.
Transcript of the walkthrough (Odoo 18)
Gantt View for Projects. A real Gantt chart for Odoo Community: drag to reschedule, dependency arrows, automatic successor shifting, critical path and milestones. Community Odoo plans projects in lists and kanbans; the schedule lives in somebody's head. This app draws it — and lets you drag it.
In the next few minutes: gantt view for projects, then what you get, then where the dates come from, then moving tasks, then critical path. Then what this app deliberately does not do, so you can tell before you buy whether it fits. Everything lives under Gantt. 1.
Install BambooForge Project Gantt (depends on Project only). 2. A Gantt menu appears in the Project app, and every project form gets a Gantt smart button scoped to that project. 3.
To see dependency arrows, enable Task Dependencies on the project. Gantt View for Projects. Community Odoo plans projects in lists and kanbans; the schedule lives in somebody's head. This app draws it — and lets you drag it.
What you get A Gantt timeline over your existing tasks: one bar per task, grouped by project or by assignee, zoomed by day, week or month, with weekend shading and a dashed today line. The chart opens scrolled to today, not to the oldest task in history. Drag to reschedule — grab a bar and move it whole days; grab either edge to stretch or shrink it. A plain click opens the task.
Automatic successor shifting: when a moved task would now overlap a task that depends on it, the dependent is pushed to start where its predecessor ends — keeping its duration — and so on down the chain. Everything that moved is written in one call. Dependency arrows drawn from Odoo's own task dependencies (Settings → Task Dependencies on the project). Critical path — one checkbox highlights the chain of dependent tasks with the largest total duration: the tasks that decide the end date.
Milestones as diamonds on the project row (green once reached). A progress strip inside each bar, set from the task form. Built from scratch in OWL and SVG. No bundled Bryntum/dhtmlx builds, no extra JavaScript licence, nothing phoning home.
Where the dates come from. The chart draws its own pair of fields — Gantt Start and Gantt End on the task (visible under Extra Info → Gantt Schedule). They are deliberately separate from the deadline: re-planning the schedule does not silently move the commitment you gave the customer. Start: the assignment date, else the creation date — at 08:00.
Length: the allocated hours at 8 h/day; else up to the deadline; else three days. The first time a task appears on the chart with no schedule, it gets a sensible one: Moving tasks Drag the bar to move it, whole days at a time (the time of day is kept, so a task that starts at 08:00 keeps starting at 08:00). Drag an edge to change the duration. If tasks depend on the one you moved and would now overlap it, they are pushed right, keeping their durations, cascading down the dependency chain.
Tasks that already start after their predecessor ends are left alone — a planned gap is your business, not the chart's. Dependency cycles (possible via imports) are detected: the shift stops instead of looping forever, and the critical path is simply not shown. Critical path. Tick Critical path and the chain of dependent tasks with the largest total duration turns red — bars and arrows.
That chain decides the project end date: shorten anything on it and the project ends earlier; shorten anything off it and nothing happens. The computation runs server-side on the tasks currently displayed. What changed in 1.1 People on the chart. The project manager sits on the project row (avatar and name); every bar carries its assignee's avatar.
Double-bookings surface themselves. One person, two open tasks, overlapping days: the bars get a warning stroke, the overlap window is shaded on the assignee lane, the toolbar counts the conflicts and can filter to them - and the tooltip names the colliding task. Working calendars. Durations count working days on the company calendar: bars start on a workday, hour-based lengths skip weekends and closing days, moved or pushed tasks never restart on a holiday, and company closing days are shaded like weekends.
What changed in 1.2 Baseline. One button freezes today's schedule; a toggle draws the frozen bars under the live ones and the tooltip states the slip in days. Re-planning stops erasing the promise it is measured against. Workload heatmap.
A toggle adds one row per person under the chart, one cell per day: green one task, amber two, red three or more - who can take more work is a glance. What changed in 1.3 Export to PNG. One button rasterises the chart, row labels included, for the status report or the site notice board. Support.
support@bambooforge.dev — answered within two business days. This module is licensed OPL-1; one purchase covers one production database plus its staging copies. Now the part most videos leave out: what this does not do. Bars snap to whole days; this is a planning chart, not a time clock.
The schedule follows the company working calendar; the critical path still weighs each bar by its calendar length, and does not model resource contention. Progress is a manual percentage — honest and simple; it does not try to guess from timesheets. Grouping by assignee shows each task under its first assignee. The complete manual is at docs dot bambooforge dot dev, the demo database is linked from the store page, and support answers within twenty-four hours.
Links are in the description.
Transcript of the walkthrough (Odoo 17)
Gantt View for Projects. A real Gantt chart for Odoo Community: drag to reschedule, dependency arrows, automatic successor shifting, critical path and milestones. Community Odoo plans projects in lists and kanbans; the schedule lives in somebody's head. This app draws it — and lets you drag it.
In the next few minutes: gantt view for projects, then what you get, then where the dates come from, then moving tasks, then critical path. Then what this app deliberately does not do, so you can tell before you buy whether it fits. Everything lives under Gantt. 1.
Install BambooForge Project Gantt (depends on Project only). 2. A Gantt menu appears in the Project app, and every project form gets a Gantt smart button scoped to that project. 3.
To see dependency arrows, enable Task Dependencies on the project. Gantt View for Projects. Community Odoo plans projects in lists and kanbans; the schedule lives in somebody's head. This app draws it — and lets you drag it.
What you get A Gantt timeline over your existing tasks: one bar per task, grouped by project or by assignee, zoomed by day, week or month, with weekend shading and a dashed today line. The chart opens scrolled to today, not to the oldest task in history. Drag to reschedule — grab a bar and move it whole days; grab either edge to stretch or shrink it. A plain click opens the task.
Automatic successor shifting: when a moved task would now overlap a task that depends on it, the dependent is pushed to start where its predecessor ends — keeping its duration — and so on down the chain. Everything that moved is written in one call. Dependency arrows drawn from Odoo's own task dependencies (Settings → Task Dependencies on the project). Critical path — one checkbox highlights the chain of dependent tasks with the largest total duration: the tasks that decide the end date.
Milestones as diamonds on the project row (green once reached). A progress strip inside each bar, set from the task form. Built from scratch in OWL and SVG. No bundled Bryntum/dhtmlx builds, no extra JavaScript licence, nothing phoning home.
Where the dates come from. The chart draws its own pair of fields — Gantt Start and Gantt End on the task (visible under Extra Info → Gantt Schedule). They are deliberately separate from the deadline: re-planning the schedule does not silently move the commitment you gave the customer. Start: the assignment date, else the creation date — at 08:00.
Length: the allocated hours at 8 h/day; else up to the deadline; else three days. The first time a task appears on the chart with no schedule, it gets a sensible one: Moving tasks Drag the bar to move it, whole days at a time (the time of day is kept, so a task that starts at 08:00 keeps starting at 08:00). Drag an edge to change the duration. If tasks depend on the one you moved and would now overlap it, they are pushed right, keeping their durations, cascading down the dependency chain.
Tasks that already start after their predecessor ends are left alone — a planned gap is your business, not the chart's. Dependency cycles (possible via imports) are detected: the shift stops instead of looping forever, and the critical path is simply not shown. Critical path. Tick Critical path and the chain of dependent tasks with the largest total duration turns red — bars and arrows.
That chain decides the project end date: shorten anything on it and the project ends earlier; shorten anything off it and nothing happens. The computation runs server-side on the tasks currently displayed. What changed in 1.1 People on the chart. The project manager sits on the project row (avatar and name); every bar carries its assignee's avatar.
Double-bookings surface themselves. One person, two open tasks, overlapping days: the bars get a warning stroke, the overlap window is shaded on the assignee lane, the toolbar counts the conflicts and can filter to them - and the tooltip names the colliding task. Working calendars. Durations count working days on the company calendar: bars start on a workday, hour-based lengths skip weekends and closing days, moved or pushed tasks never restart on a holiday, and company closing days are shaded like weekends.
What changed in 1.2 Baseline. One button freezes today's schedule; a toggle draws the frozen bars under the live ones and the tooltip states the slip in days. Re-planning stops erasing the promise it is measured against. Workload heatmap.
A toggle adds one row per person under the chart, one cell per day: green one task, amber two, red three or more - who can take more work is a glance. What changed in 1.3 Export to PNG. One button rasterises the chart, row labels included, for the status report or the site notice board. Support.
support@bambooforge.dev — answered within two business days. This module is licensed OPL-1; one purchase covers one production database plus its staging copies. Now the part most videos leave out: what this does not do. Bars snap to whole days; this is a planning chart, not a time clock.
The schedule follows the company working calendar; the critical path still weighs each bar by its calendar length, and does not model resource contention. Progress is a manual percentage — honest and simple; it does not try to guess from timesheets. Grouping by assignee shows each task under its first assignee. The complete manual is at docs dot bambooforge dot dev, the demo database is linked from the store page, and support answers within twenty-four hours.
Links are in the description.
Transcript of the walkthrough (Odoo 16)
Gantt View for Projects. A real Gantt chart for Odoo Community: drag to reschedule, dependency arrows, automatic successor shifting, critical path and milestones. Community Odoo plans projects in lists and kanbans; the schedule lives in somebody's head. This app draws it — and lets you drag it.
In the next few minutes: gantt view for projects, then what you get, then where the dates come from, then moving tasks, then critical path. Then what this app deliberately does not do, so you can tell before you buy whether it fits. Everything lives under Gantt. 1.
Install BambooForge Project Gantt (depends on Project only). 2. A Gantt menu appears in the Project app, and every project form gets a Gantt smart button scoped to that project. 3.
To see dependency arrows, enable Task Dependencies on the project. Gantt View for Projects. Community Odoo plans projects in lists and kanbans; the schedule lives in somebody's head. This app draws it — and lets you drag it.
What you get A Gantt timeline over your existing tasks: one bar per task, grouped by project or by assignee, zoomed by day, week or month, with weekend shading and a dashed today line. The chart opens scrolled to today, not to the oldest task in history. Drag to reschedule — grab a bar and move it whole days; grab either edge to stretch or shrink it. A plain click opens the task.
Automatic successor shifting: when a moved task would now overlap a task that depends on it, the dependent is pushed to start where its predecessor ends — keeping its duration — and so on down the chain. Everything that moved is written in one call. Dependency arrows drawn from Odoo's own task dependencies (Settings → Task Dependencies on the project). Critical path — one checkbox highlights the chain of dependent tasks with the largest total duration: the tasks that decide the end date.
Milestones as diamonds on the project row (green once reached). A progress strip inside each bar, set from the task form. Built from scratch in OWL and SVG. No bundled Bryntum/dhtmlx builds, no extra JavaScript licence, nothing phoning home.
Where the dates come from. The chart draws its own pair of fields — Gantt Start and Gantt End on the task (visible under Extra Info → Gantt Schedule). They are deliberately separate from the deadline: re-planning the schedule does not silently move the commitment you gave the customer. Start: the assignment date, else the creation date — at 08:00.
Length: the allocated hours at 8 h/day; else up to the deadline; else three days. The first time a task appears on the chart with no schedule, it gets a sensible one: Moving tasks Drag the bar to move it, whole days at a time (the time of day is kept, so a task that starts at 08:00 keeps starting at 08:00). Drag an edge to change the duration. If tasks depend on the one you moved and would now overlap it, they are pushed right, keeping their durations, cascading down the dependency chain.
Tasks that already start after their predecessor ends are left alone — a planned gap is your business, not the chart's. Dependency cycles (possible via imports) are detected: the shift stops instead of looping forever, and the critical path is simply not shown. Critical path. Tick Critical path and the chain of dependent tasks with the largest total duration turns red — bars and arrows.
That chain decides the project end date: shorten anything on it and the project ends earlier; shorten anything off it and nothing happens. The computation runs server-side on the tasks currently displayed. What changed in 1.1 People on the chart. The project manager sits on the project row (avatar and name); every bar carries its assignee's avatar.
Double-bookings surface themselves. One person, two open tasks, overlapping days: the bars get a warning stroke, the overlap window is shaded on the assignee lane, the toolbar counts the conflicts and can filter to them - and the tooltip names the colliding task. Working calendars. Durations count working days on the company calendar: bars start on a workday, hour-based lengths skip weekends and closing days, moved or pushed tasks never restart on a holiday, and company closing days are shaded like weekends.
What changed in 1.2 Baseline. One button freezes today's schedule; a toggle draws the frozen bars under the live ones and the tooltip states the slip in days. Re-planning stops erasing the promise it is measured against. Workload heatmap.
A toggle adds one row per person under the chart, one cell per day: green one task, amber two, red three or more - who can take more work is a glance. What changed in 1.3 Export to PNG. One button rasterises the chart, row labels included, for the status report or the site notice board. Support.
support@bambooforge.dev — answered within two business days. This module is licensed OPL-1; one purchase covers one production database plus its staging copies. Now the part most videos leave out: what this does not do. Bars snap to whole days; this is a planning chart, not a time clock.
The schedule follows the company working calendar; the critical path still weighs each bar by its calendar length, and does not model resource contention. Progress is a manual percentage — honest and simple; it does not try to guess from timesheets. Grouping by assignee shows each task under its first assignee. The complete manual is at docs dot bambooforge dot dev, the demo database is linked from the store page, and support answers within twenty-four hours.
Links are in the description.
Key facts
- What it is
- A real Gantt chart for Odoo Community: auto-schedule with MS Project constraints, drag to reschedule, links by drag, critical path and float, subtasks, portfolio, workload in hours, baseline, MS Project / Excel / PDF in and out.
- For
- Project
- Odoo versions
- 16.0, 17.0, 18.0, 19.0, 20.0 - Community and Enterprise
- Runs on
- Odoo.sh or Odoo you host yourself - not Odoo Online, which accepts no third-party apps
- Price
- 249 EUR, one-time, on the Odoo Apps Store
- Technical name
- bambooforge_gantt
- Not for
- Bars snap to whole days; this is a planning chart, not a time clock.; The scheduler is a forward pass: it packs early and never levels resources. Two people over capacity are shown in red, not fixed.; The critical path and float weigh each bar by its length in days and do not model resource contention.; Progress is a manual percentage - honest and simple; it does not try to guess from timesheets.; Grouping by assignee shows each task under its first assignee.; A parent task's dates are its own; nothing is rolled up.
- Manual last updated
- 2026-10-15
Gantt View for Projects
Community Odoo plans projects in lists and kanbans; the schedule lives in somebody's head. This app draws it — and lets you drag it.
What you get
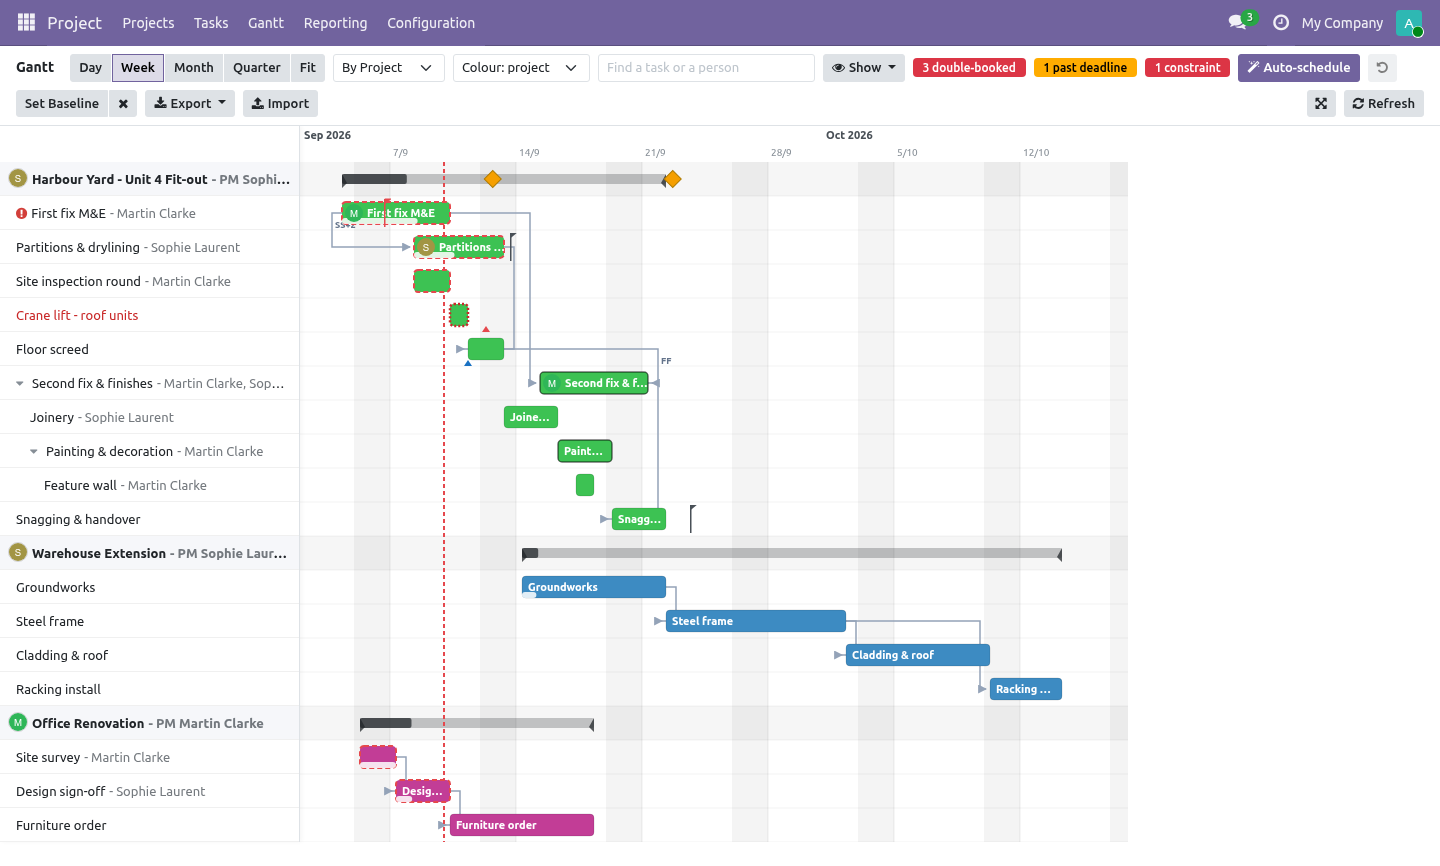
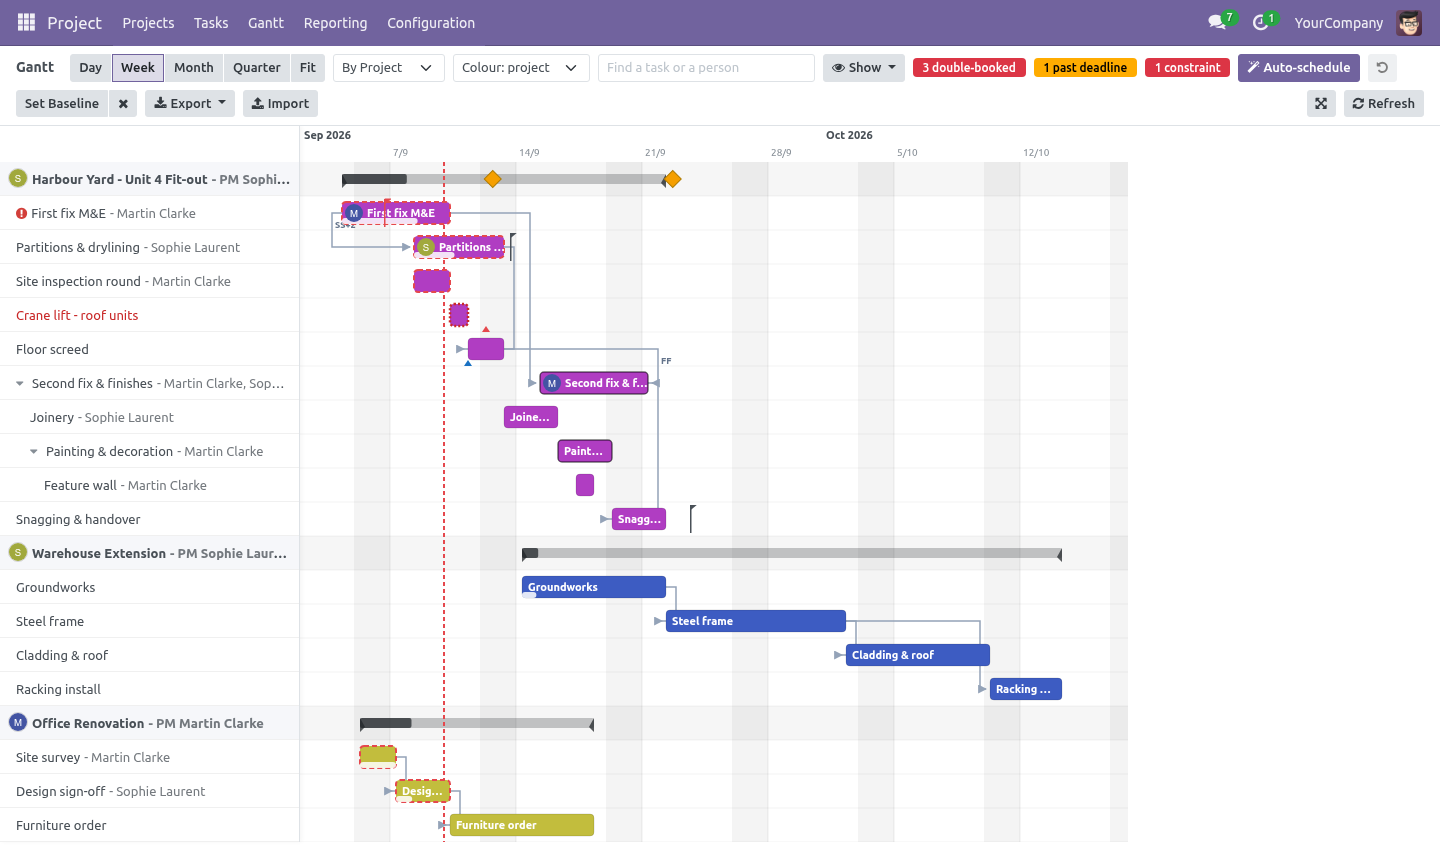
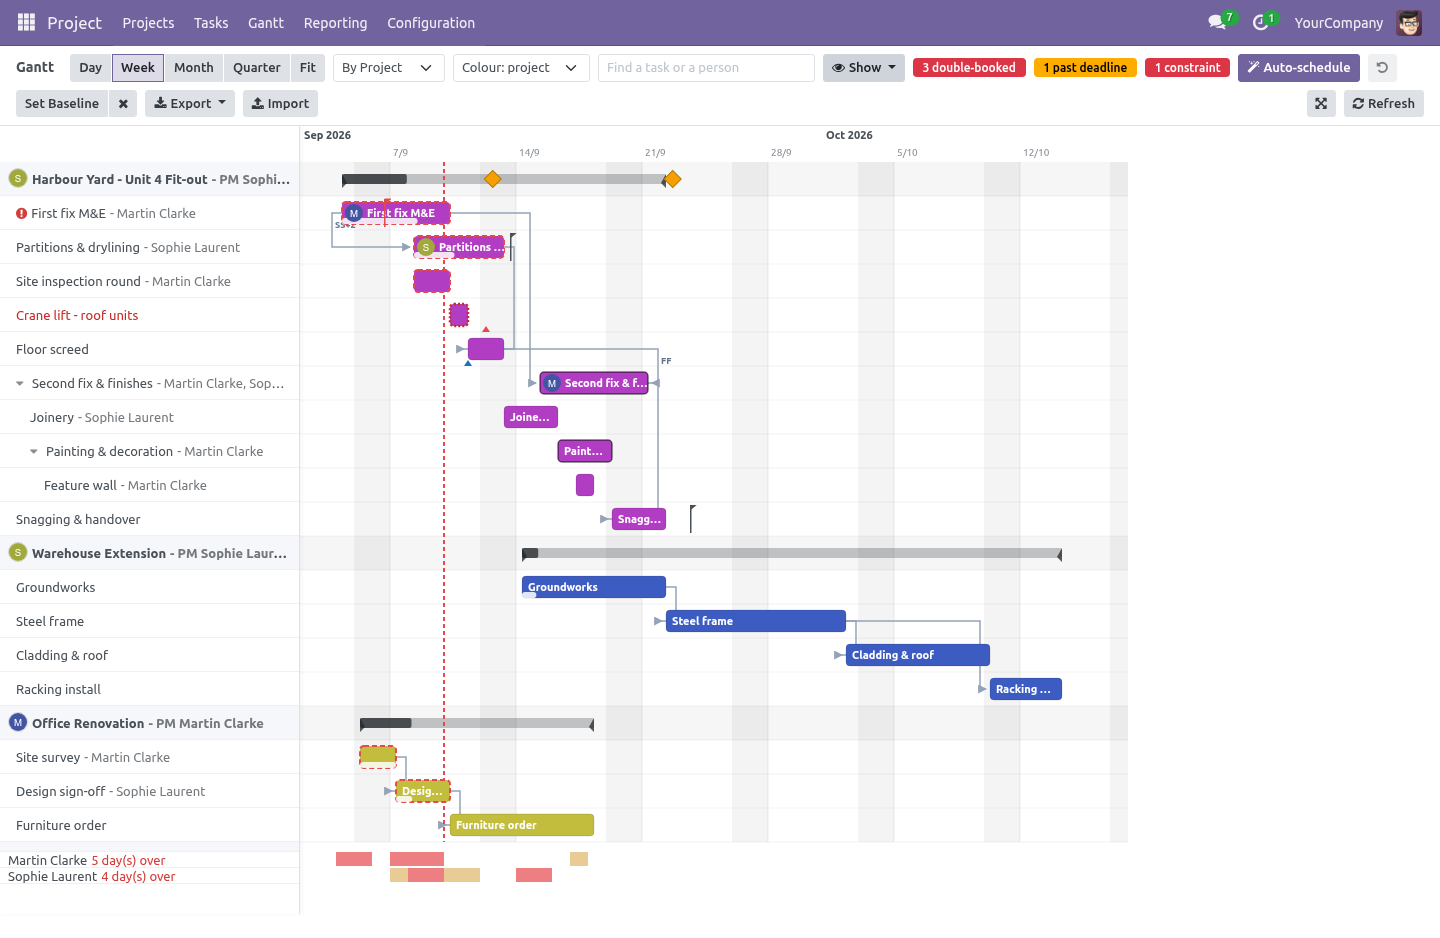
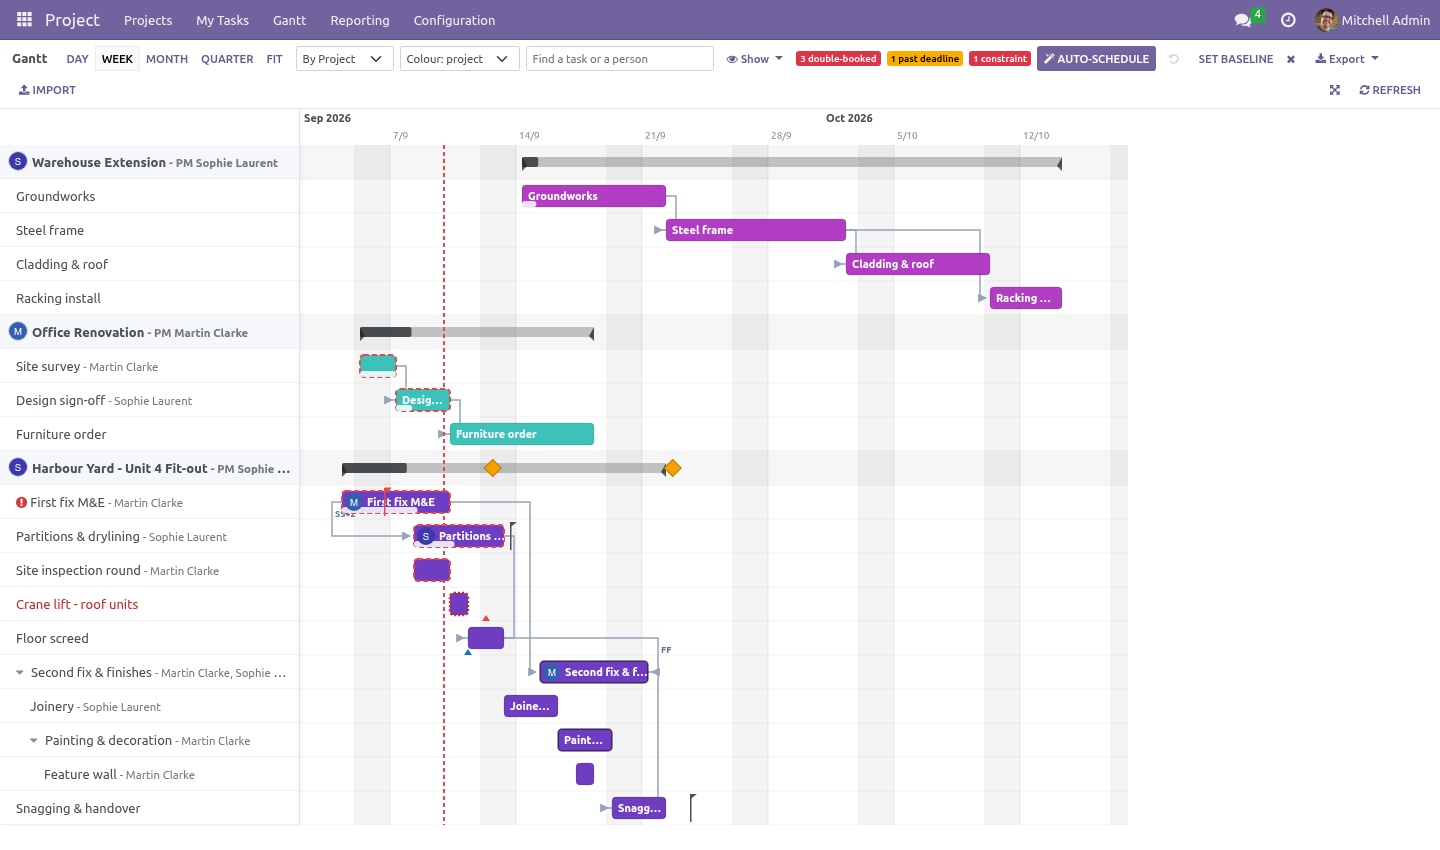
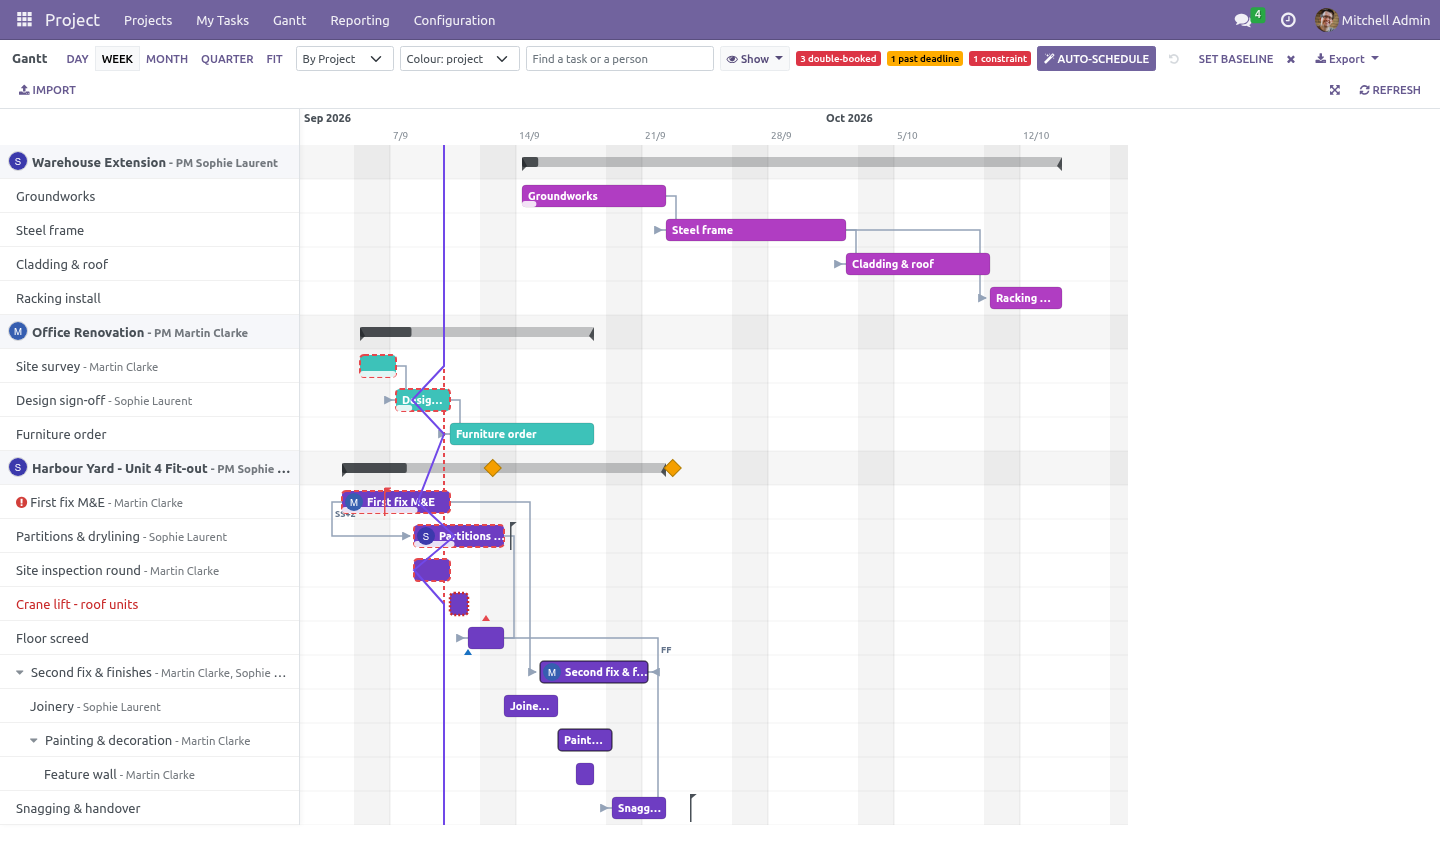
A Gantt timeline over your existing tasks: one bar per task, grouped by project or by assignee, zoomed by day, week, month or quarter - or Fit, which sizes the whole plan to the window - with weekend shading and a dashed today line. The chart opens scrolled to today.
Drag to reschedule - grab a bar and move it whole days; grab either edge to stretch or shrink it. A plain click opens the task. Undo puts the last move back, successors included.
Automatic successor shifting: when a moved task would now overlap a task that depends on it, the dependent is pushed to start where its predecessor ends - keeping its duration - and so on down the chain.
Auto-schedule: one button packs every open task as early as its dependencies, its constraints and the working calendar allow, the way MS Project's automatic mode does.
Schedule constraints on a task - Start No Earlier Than, Must Finish On and the rest of the MS Project set - drawn as a pin under the bar, red when the bar breaks them.
Dependency arrows drawn from Odoo's own task dependencies, typed (FS, SS, FF, SF) with a lag; draw a new one by dragging the handle at the end of a bar onto another bar, click an arrow to remove it.
Critical path and float: the chain that decides the end date turns red; every other task's tooltip says how many days it can slip.
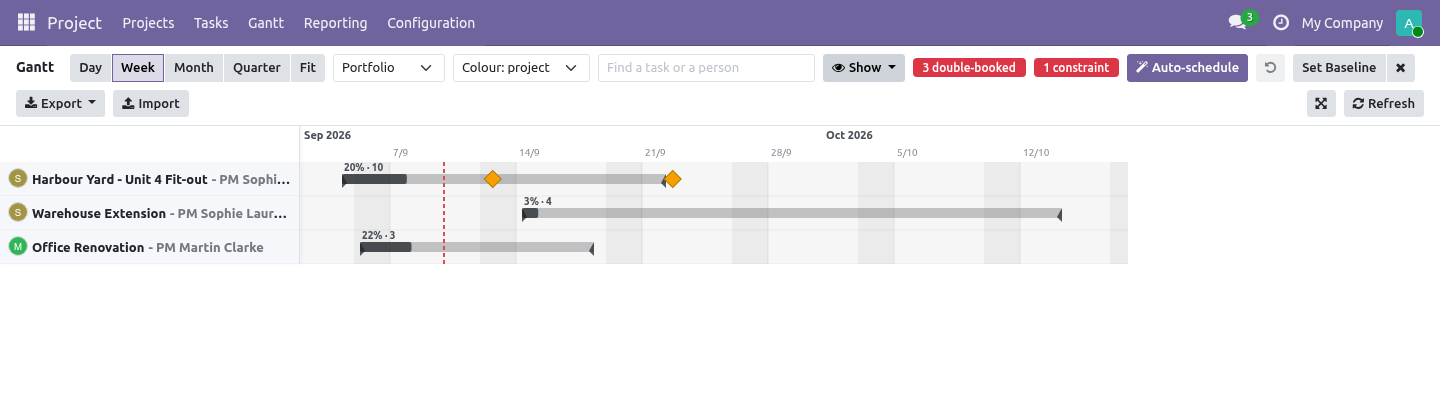
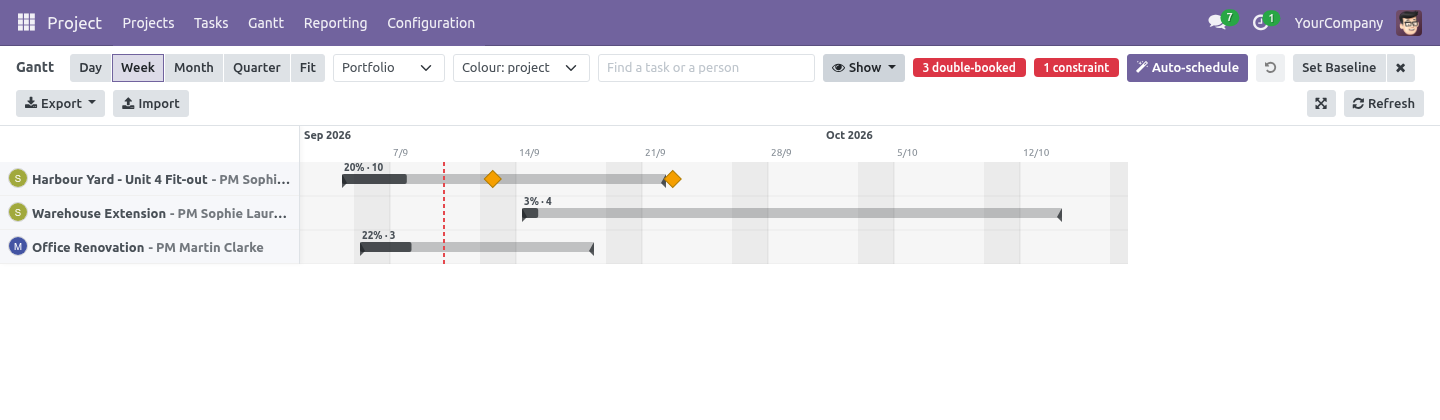
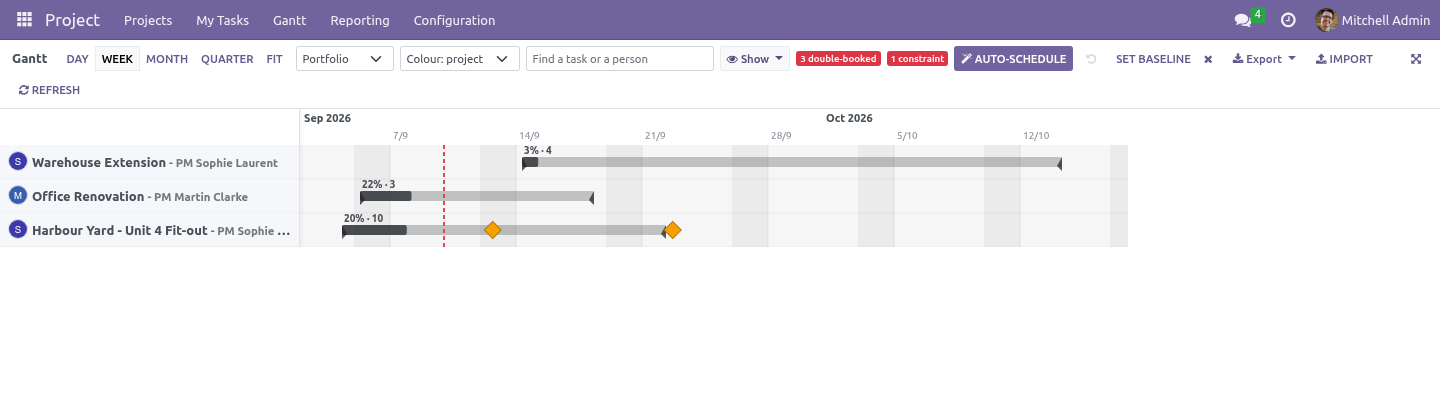
Subtasks nested under their parent at any depth, folded with a caret; summary bars on every project row; a Portfolio view with one bar per project.
Baseline: freeze the plan, draw it under the live bars, read the slip in days. Progress line: a zig-zag against today that shows what is behind and what is ahead at a glance.
Deadlines as a flag on the bar, red once missed, with a count in the toolbar; colour by project, stage, assignee or deadline.
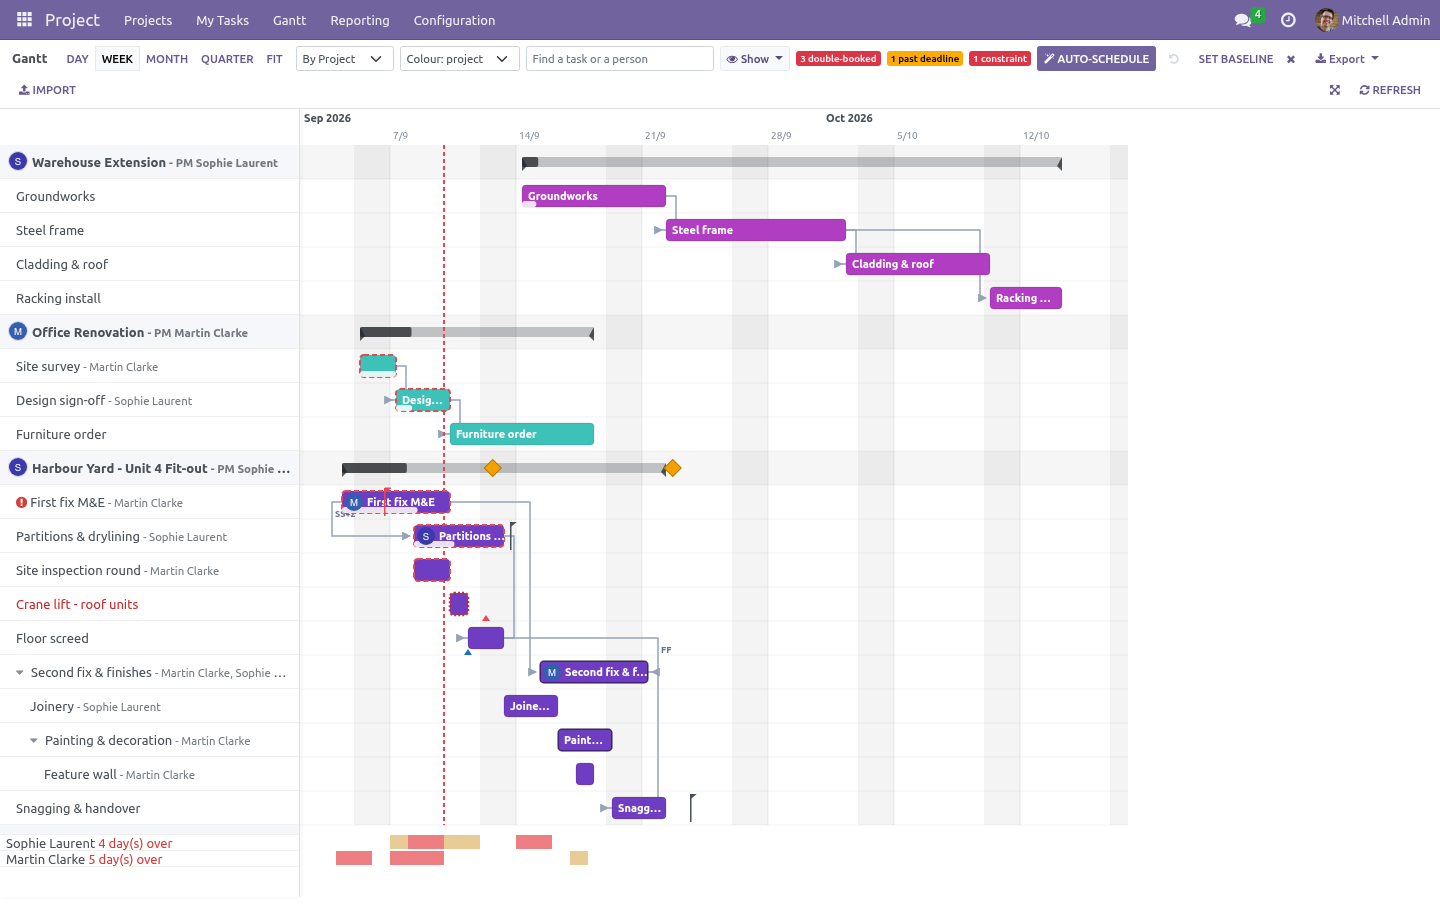
Workload in hours: one row per person, one cell per day, the hours laid on them against the hours the calendar gives them - red when over.
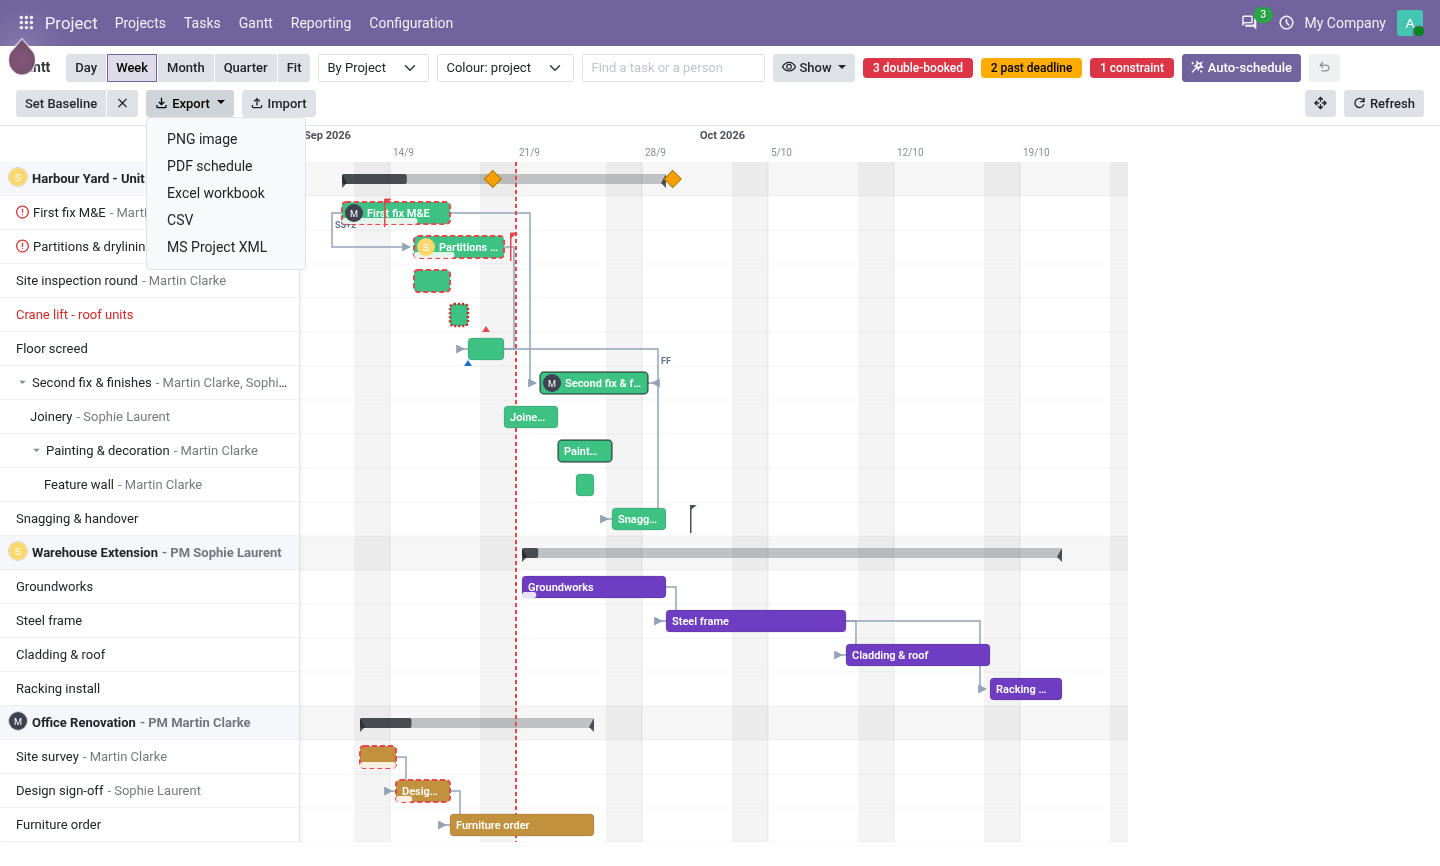
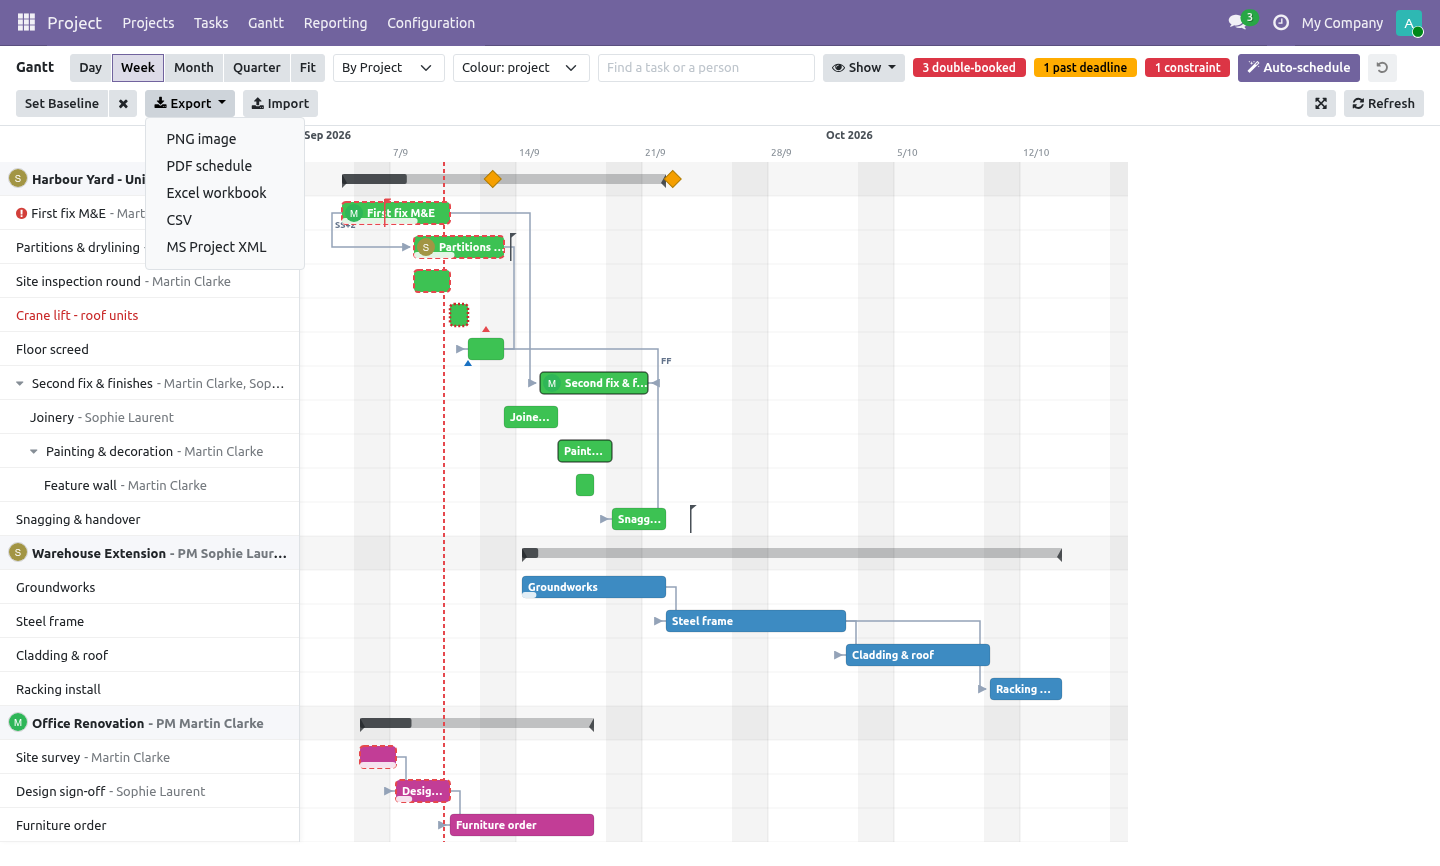
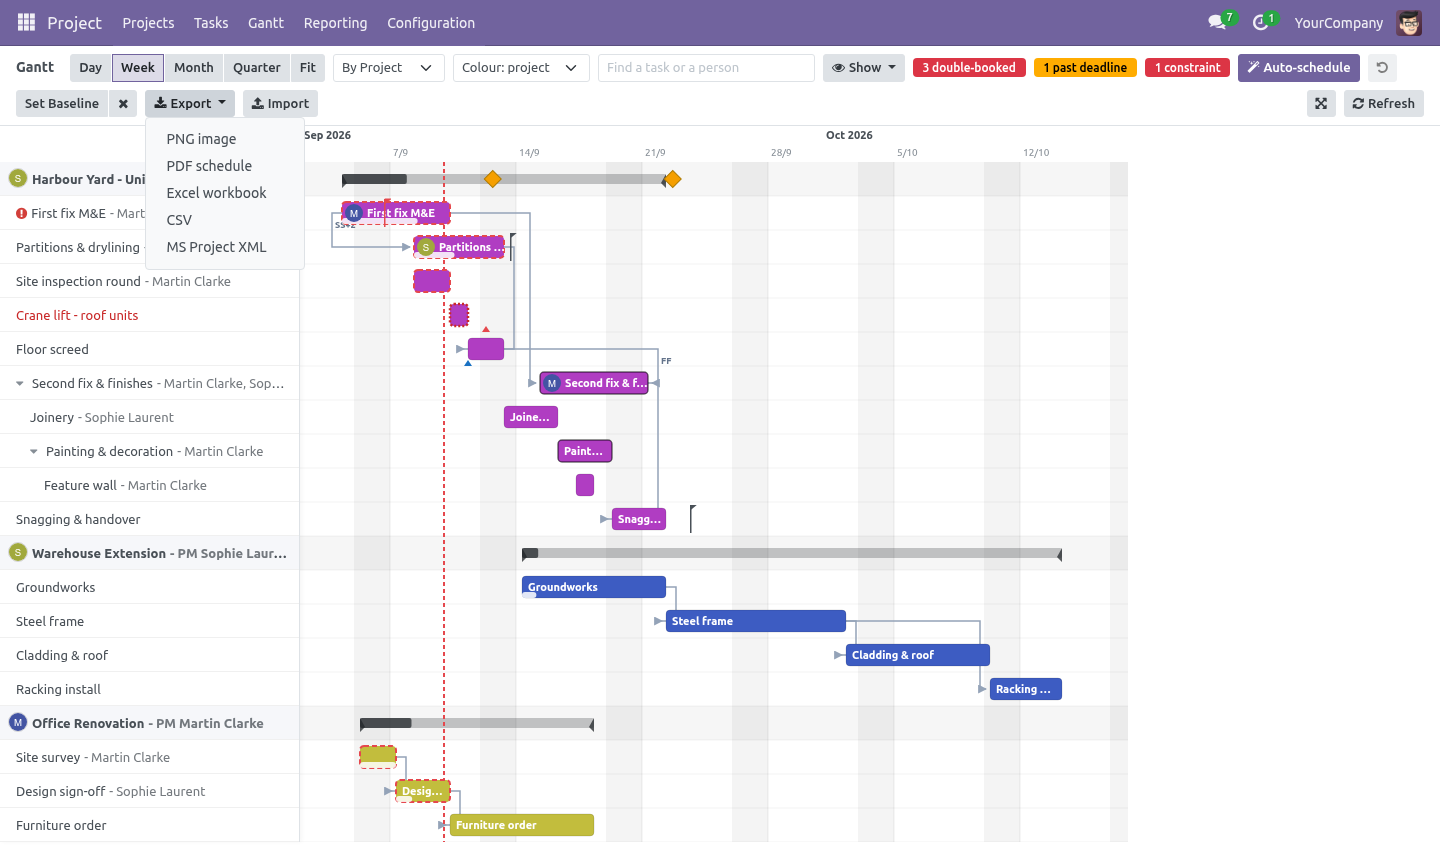
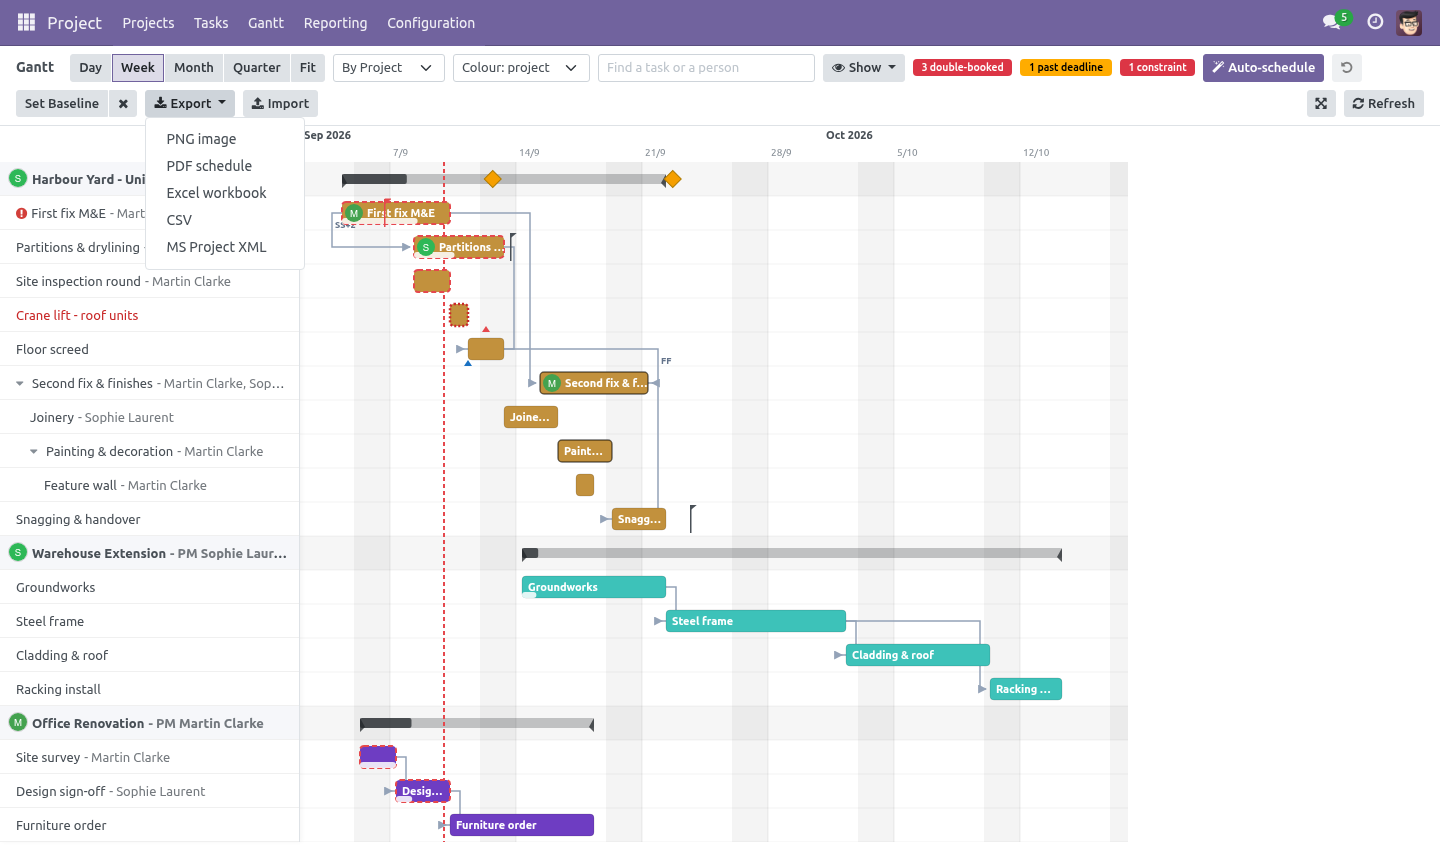
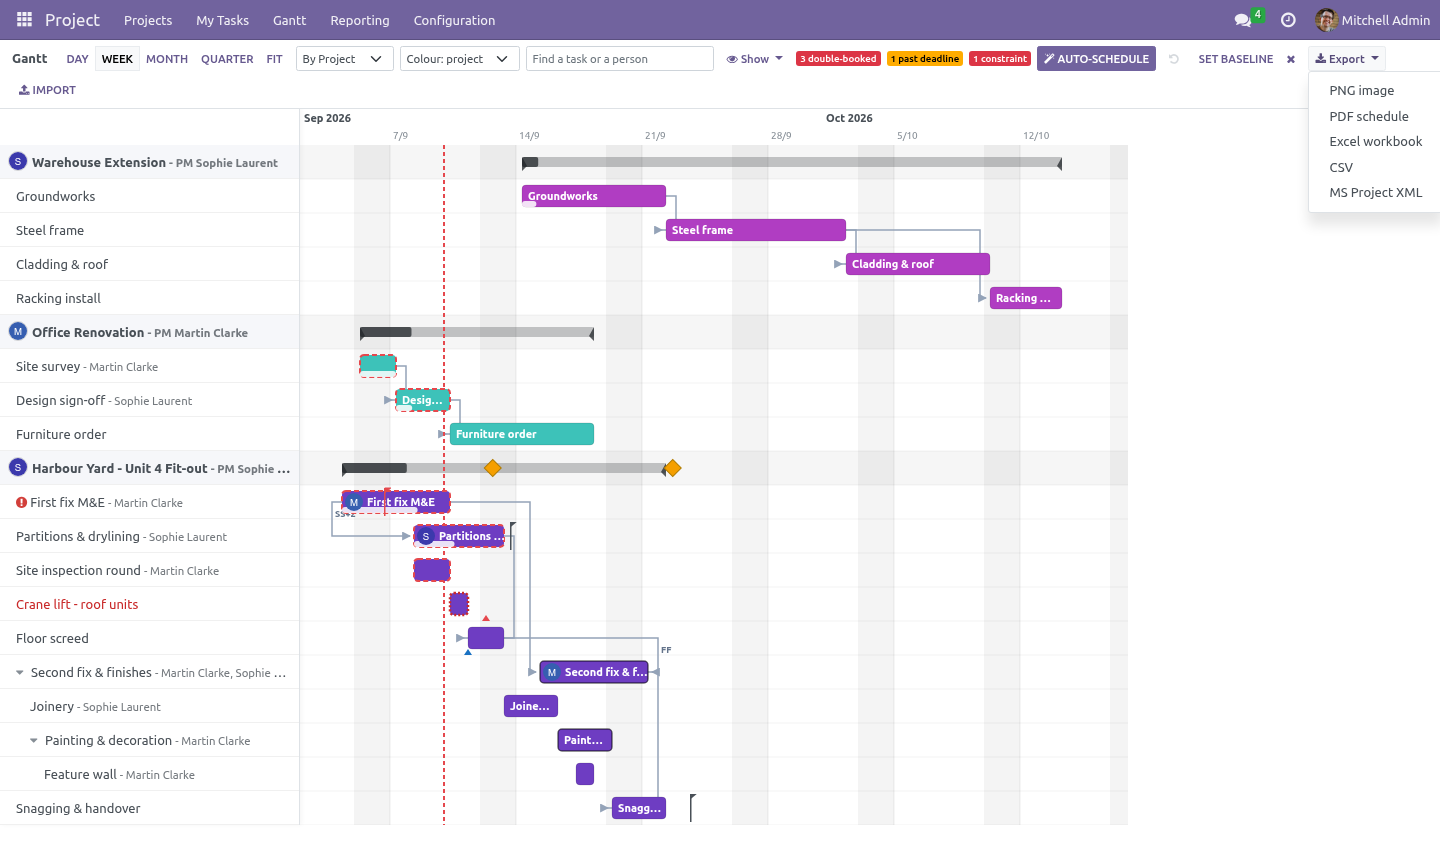
Files in and out: export PNG, a printed PDF schedule, Excel, CSV or MS Project XML; import MS Project XML, Excel or CSV into a project.
Milestones as diamonds on the project row (green once reached); company closing days shaded like weekends; double-bookings flagged.
Built from scratch in OWL and SVG. No bundled Bryntum/dhtmlx builds, no extra JavaScript licence, nothing phoning home.
Install
Install BambooForge Project Gantt (depends on Project only).
A Gantt menu appears in the Project app, and every project form gets a Gantt smart button scoped to that project.
To see dependency arrows, enable Task Dependencies on the project.
Set the project's start date if you want Auto-schedule to pack the plan from it; without one it packs from the earliest bar.
Where the dates come from
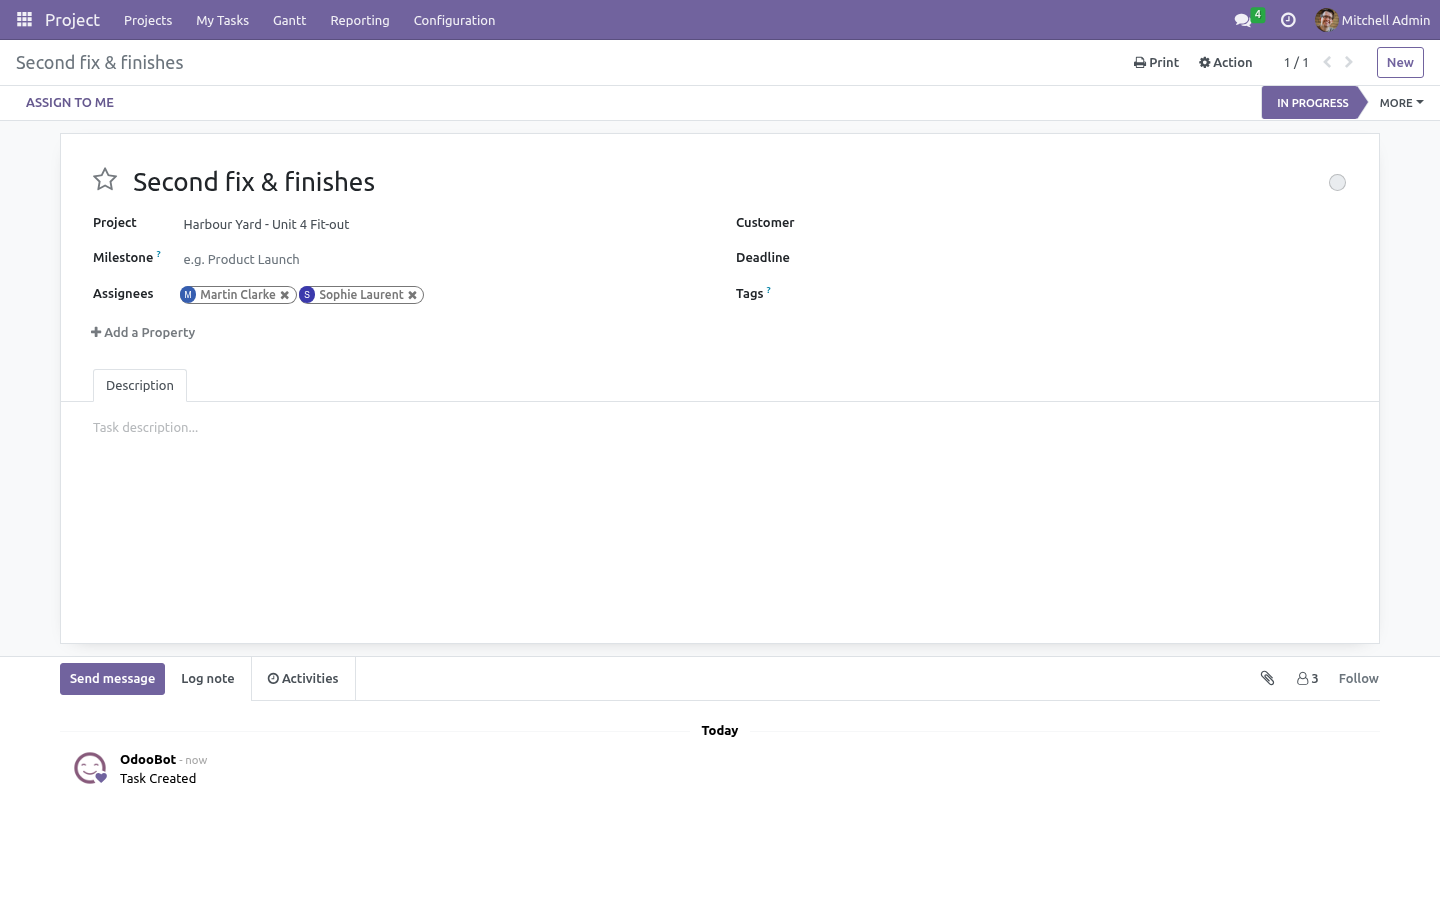
The chart draws its own pair of fields — Gantt Start and Gantt End on the task (visible under Extra Info → Gantt Schedule). They are deliberately separate from the deadline: re-planning the schedule does not silently move the commitment you gave the customer.
The first time a task appears on the chart with no schedule, it gets a sensible one:
Start: the assignment date, else the creation date — at 08:00.
Length: the allocated hours at 8 h/day; else up to the deadline; else three days.
After that the fields belong to you — the chart, the task form and any automation all write the same two fields.
Moving tasks
Drag the bar to move it, whole days at a time (the time of day is kept, so a task that starts at 08:00 keeps starting at 08:00).
Drag an edge to change the duration.
If tasks depend on the one you moved and would now overlap it, they are pushed right, keeping their durations, cascading down the dependency chain. Tasks that already start after their predecessor ends are left alone - a planned gap is your business, not the chart's. A pushed task never lands before its own Start No Earlier Than.
Undo (the arrow next to Auto-schedule) restores the bars of the task you moved and of everything the move pushed. Thirty steps deep.
Dependency cycles (possible via imports) are detected: the shift stops instead of looping forever, and the critical path is simply not shown.
Constraints and the automatic scheduler
A task carries a schedule constraint (Extra Info → Gantt Schedule):
As Soon As Possible - the default; the scheduler may put it anywhere its predecessors allow.
Start No Earlier Than / Finish No Earlier Than - a fence: the scheduler will not pull it before the date.
Start No Later Than / Finish No Later Than - a deadline for the scheduler: it cannot force it, but it reports the breach.
Must Start On / Must Finish On - pinned. The bar goes on the date even if a predecessor ends after it, and the chart shows the clash.
A constraint is drawn as a small pin under the bar (blue; red when the bar breaks it), the row label turns red, the toolbar counts the breaches, and the tooltip states the rule.
Auto-schedule runs a forward pass in dependency order over the open tasks on the chart: a task with no predecessor starts at the project's start date (else at the earliest bar of the plan); every other task starts at the latest of its predecessors' targets - finish-to-start, start-to-start, lag and lead all honoured - and its own fence; the start snaps to a working day; the duration is kept. Closed tasks are not moved: they are history, and they still anchor what depended on them. A banner lists any constraint that could not be honoured. The button is one Undo step.
Links drawn on the chart
Hover a bar: a small circle appears at its end. Drag it onto another bar and that task now depends on this one (finish-to-start; open the task to change the type or add a lag). A link that would make a loop is refused with both task names in the message. Click an arrow and confirm to remove the dependency - the typed row and Odoo's own link go together.
Subtasks and the portfolio
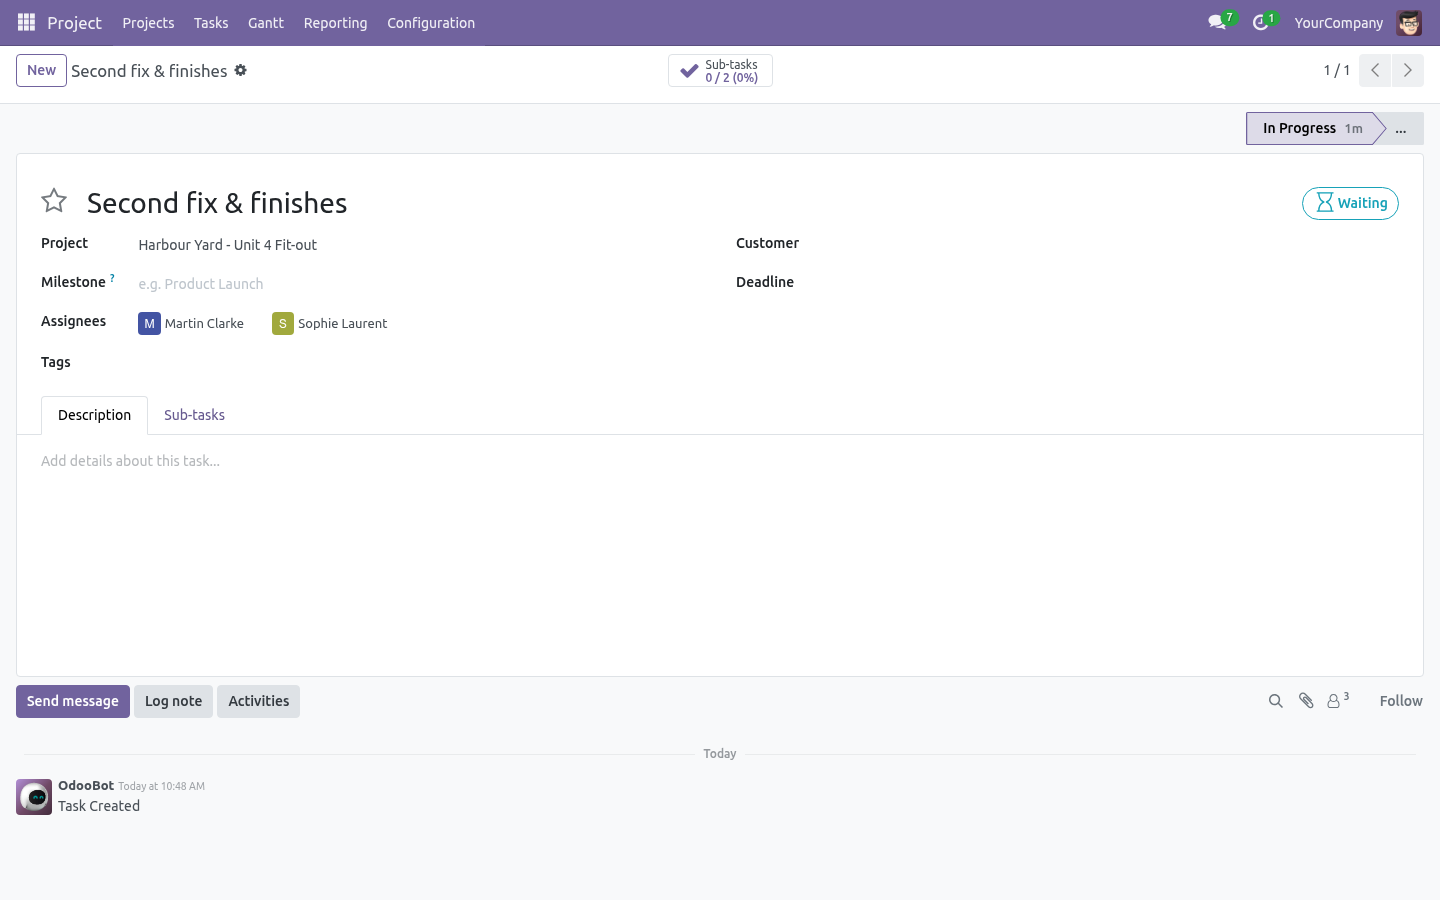
Sub-tasks sit under their parent, indented, at any depth; the caret in the row label folds them. A parent's bar keeps a darker outline; its own dates stay its own - the chart does not roll children up into the parent, because a parent whose dates are computed cannot be planned.
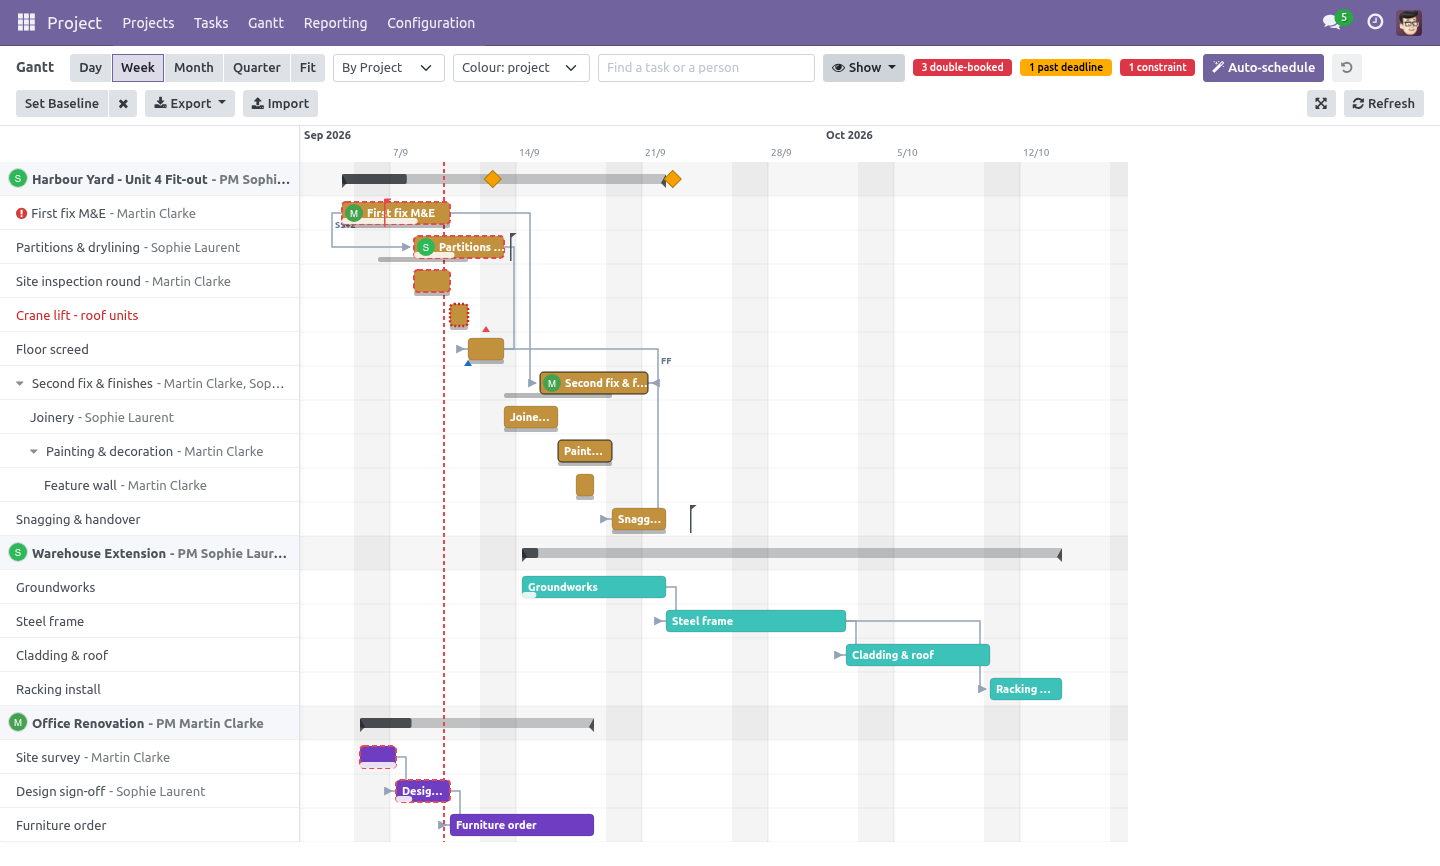
Every project row carries a summary bar: earliest start to latest end of its tasks, the done part filled, progress weighted by duration. Switch the grouping to Portfolio and only those rows remain - every project on one timeline, a percentage next to each - and a click on a summary opens that project's own chart.
Critical path and float
Tick Critical path and the chain of dependent tasks with the largest total duration turns red - bars and arrows. That chain decides the project end date: shorten anything on it and the project ends earlier; shorten anything off it and nothing happens. The computation runs server-side on the tasks currently displayed.
Every linked task's tooltip also states its float: the days it can slip before the end date moves, from the classic forward and backward pass over durations and lags. Zero float is the critical path.
Progress line and deadlines
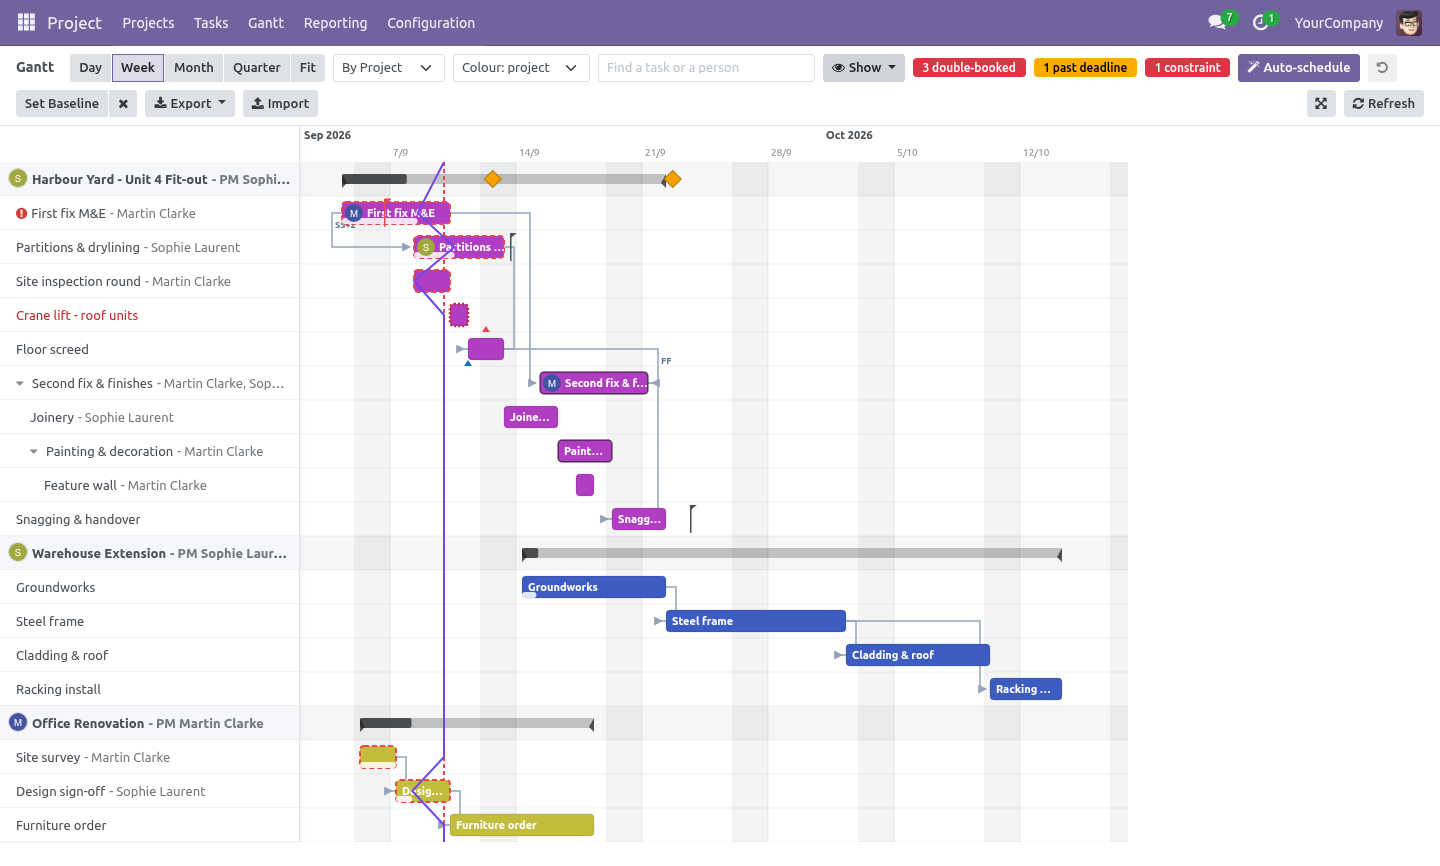
Tick Progress line and a line runs down from today, bending left to every bar whose progress strip has not reached today (behind) and right to every bar that is ahead. It is the one picture a steering meeting needs.
A task's deadline is a flag on its bar; it turns red once the bar ends after the deadline or the deadline has passed with the task open, the row label gets a warning mark and the toolbar counts them. Colour the bars by deadline to see green (time left), amber (three days or fewer) and red (missed) across the whole plan.
Workload in hours
Tick Workload and one row per person appears under the chart, one cell per day. A task's hours (its allocated hours, else eight for every working day it covers) are spread evenly over the working days it spans and over its assignees; the cell compares that with the hours the company calendar gives that day. Light green is half a day or less, amber a full day, red more than the day has - and the row label counts the days a person is over.
Files in and out
Export offers five shapes of the tasks on the chart:
PNG - the chart as drawn, row labels included.
PDF - a printed schedule table: WBS, task, dates, working days, progress, people, predecessors by WBS, slip against the baseline; the critical path marked.
Excel and CSV - one row per task with every column the chart knows, predecessors written the MS Project way (12FS+2).
MS Project XML - the mspdi schema that Project, Primavera P6, ProjectLibre and GanttProject open: outline levels, links with type and lag, constraints, deadlines, baselines, resources and assignments.
Import reads the same three files into a project: rows become tasks with their bars, progress, people (matched by name), predecessors and constraints; outline levels, indented names or a WBS column become sub-tasks. A row whose name matches an open task updates it instead of creating a second one, so a plan can go out to Excel and come back.
Limits, stated plainly
Bars snap to whole days; this is a planning chart, not a time clock.
The scheduler is a forward pass: it packs early and never levels resources. Two people over capacity are shown in red, not fixed.
The critical path and float weigh each bar by its length in days and do not model resource contention.
Progress is a manual percentage - honest and simple; it does not try to guess from timesheets.
Grouping by assignee shows each task under its first assignee.
A parent task's dates are its own; nothing is rolled up.
What changed in 2.0
Auto-schedule and schedule constraints - the seven-type MS Project set - with breaches drawn, counted and listed.
Links by drag, removal by click, loops refused by name.
Float in every tooltip; subtasks at any depth with folding; summary bars and a Portfolio grouping.
Progress line, deadline flags with an overdue count, colour by stage, assignee or deadline; Quarter zoom and Fit; full-screen; a search box; grid lines that switch off.
Workload in hours against the calendar's capacity, replacing the task count.
Export to PDF, Excel, CSV and MS Project XML; import from all three. Undo, thirty steps. Clear baseline.
What changed in 1.1
People on the chart. The project manager sits on the project row (avatar and name); every bar carries its assignee's avatar.
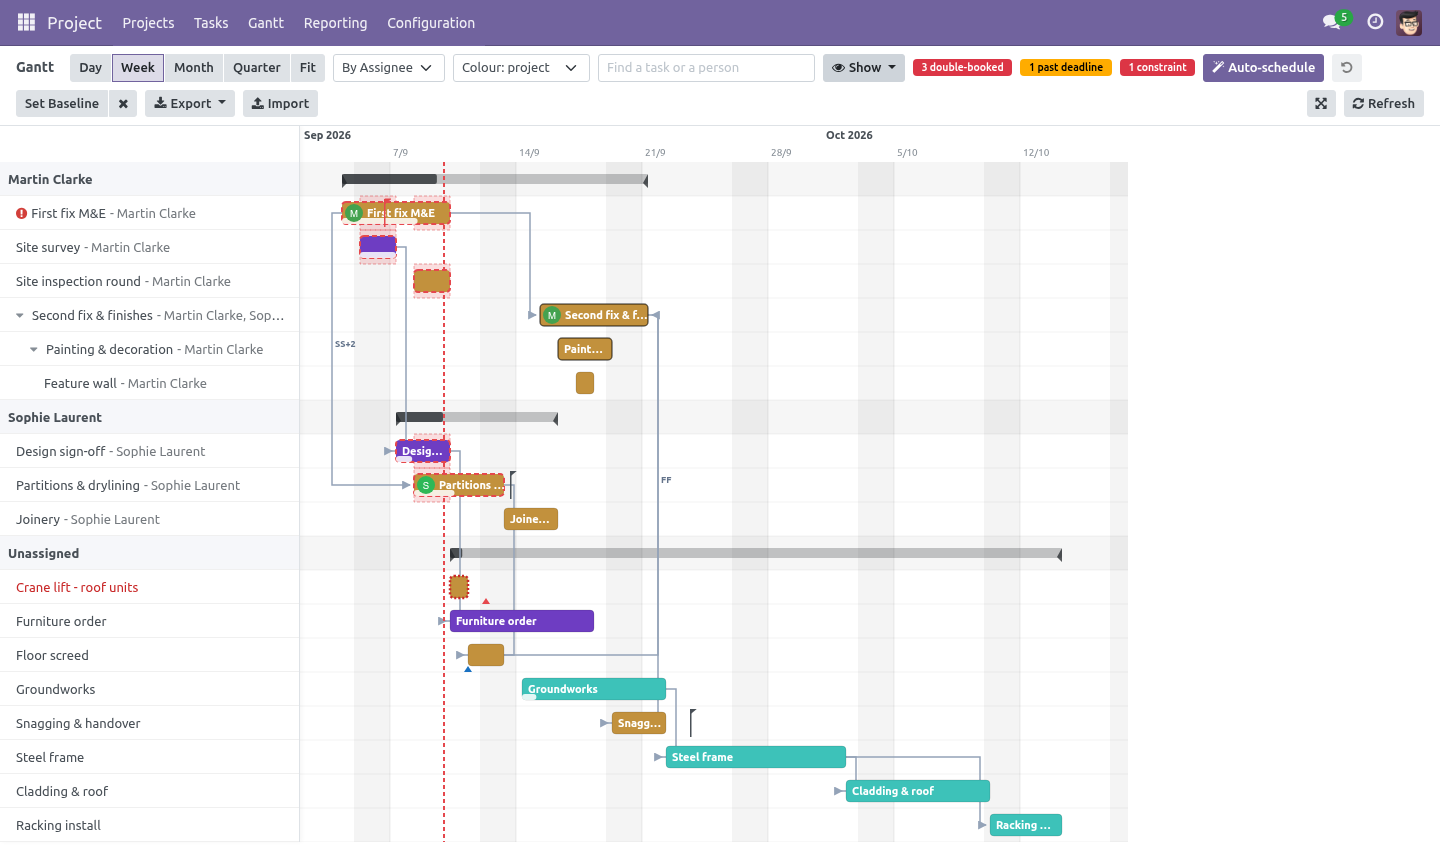
Double-bookings surface themselves. One person, two open tasks, overlapping days: the bars get a warning stroke, the overlap window is shaded on the assignee lane, the toolbar counts the conflicts and can filter to them - and the tooltip names the colliding task.
Working calendars. Durations count working days on the company calendar: bars start on a workday, hour-based lengths skip weekends and closing days, moved or pushed tasks never restart on a holiday, and company closing days are shaded like weekends.
What changed in 1.2
Baseline. One button freezes today's schedule; a toggle draws the frozen bars under the live ones and the tooltip states the slip in days. Re-planning stops erasing the promise it is measured against.
Workload heatmap. A toggle adds one row per person under the chart, one cell per day: green one task, amber two, red three or more - who can take more work is a glance.
What changed in 1.3
Typed dependencies. A dependency can now say how two tasks are tied - finish to start (the default), start to start, finish to finish or start to finish - and carry a lag in working days, negative for a lead. Rescheduling honours the relationship, the arrows leave and land at the right ends, and anything other than a plain finish-to-start is labelled on the link (SS+2, FF, FS-3).
Export to PNG. One button rasterises the chart, row labels included, for the status report or the site notice board.
How we make sure it works
Before every release, 78 automated checks run against this app on Odoo 16, 17, 18, 19 and 20. Among them:
Dependency cannot be self.
The schedule is not behind developer mode.
Import msproject from another tool.
Auto schedule must start on wins and is flagged.
Workload without hours assumes a day of eight.
The complete list is in the source you receive.
Questions people ask
- Which Odoo versions does it run on?
Odoo 16.0, 17.0, 18.0, 19.0, 20.0, on the series you buy it for; each series is its own listing.
- Community or Enterprise?
Both. It needs no Enterprise app.
- What does it need?
The standard Project app. No extra Python package.
- Where does it show up?
Under the Gantt menu.
- Does anything leave my server?
No. It makes no call outside your Odoo server: no telemetry, no licence check, no third-party service.
- What happens if I uninstall it?
Odoo drops the app's own tables and fields; the standard records it worked on (contacts, orders, products) stay as they are.
Support
support@bambooforge.dev — answered within two business days. This module is licensed OPL-1; one purchase covers one production database plus its staging copies.