 BambooForge Labs
Financial Dashboard All in One with KPI Tiles
Put any line of a Financial Reports Builder statement on a Dashboard Builder board as a tile or KPI - gross margin, EBITDA, cash - with the board's own date filter, a previous-period comparison, a target, a named owner, and a sentence that says what moved, in the alert and in the weekly snapshot.
Available for Odoo 17.0, Odoo 18.0, Odoo 19.0, Odoo 20.0. Technical name bambooforge_dashboard_fin_reports.
Transcript of the walkthrough (Odoo 20)
Financial Dashboard All in One with KPI Tiles. Put any line of a Financial Reports Builder statement on a Dashboard Builder board as a tile or KPI - gross margin, EBITDA, cash - with the board's own date filter, a previous-period comparison, a target, a named owner, and a sentence that says what moved, in the alert and in the weekly snapshot. Dashboard Builder draws numbers from any model. Financial Reports Builder computes the numbers finance actually reports on.
This bridge puts a statement line on a board - and tells you, in one sentence, what moved. In the next few minutes: financial kpis on the dashboard, then what you get, then putting a statement line on a board, then what moved, then how we make sure it works. Then what this app deliberately does not do, so you can tell before you buy whether it fits. Needs Dashboard Builder and Financial Reports Builder, both by BambooForge; the store price of this page includes them.
Install the bridge and the new data type appears on every tile and KPI form. Financial KPIs on the Dashboard. Dashboard Builder draws numbers from any model. Financial Reports Builder computes the numbers finance actually reports on.
This bridge puts a statement line on a board - and tells you, in one sentence, what moved. What you get A new data type on a tile or a KPI: Financial report line. Pick a report and a line - a prefix line such as revenue, a type line such as cash, or a formula line such as EBITDA - and its amount is the number on the board. The board's date filter is the report's period: month to date, last quarter, a custom range.
A balance sheet line is read as at the end of the period, the way the report's own Run form does it. Previous period and target work exactly as for any other KPI. Month to date compares with the same days of the month before, a quarter with the quarter before, a year with the year before; any other range with the same number of days ending the day before it. A KPI owner: the person who answers for the number.
Added to every alert on the item and named in the snapshot. What moved: one sentence on the KPI form, in the threshold alert e-mail and in the scheduled snapshot - "EUR 1.35M, up 12.5% on the previous period (EUR 1.20M); 90% of the EUR 1.50M target." Multi-currency: a report in another company's currency is converted to the board's currency at the period end. Putting a statement line on a board. 1.
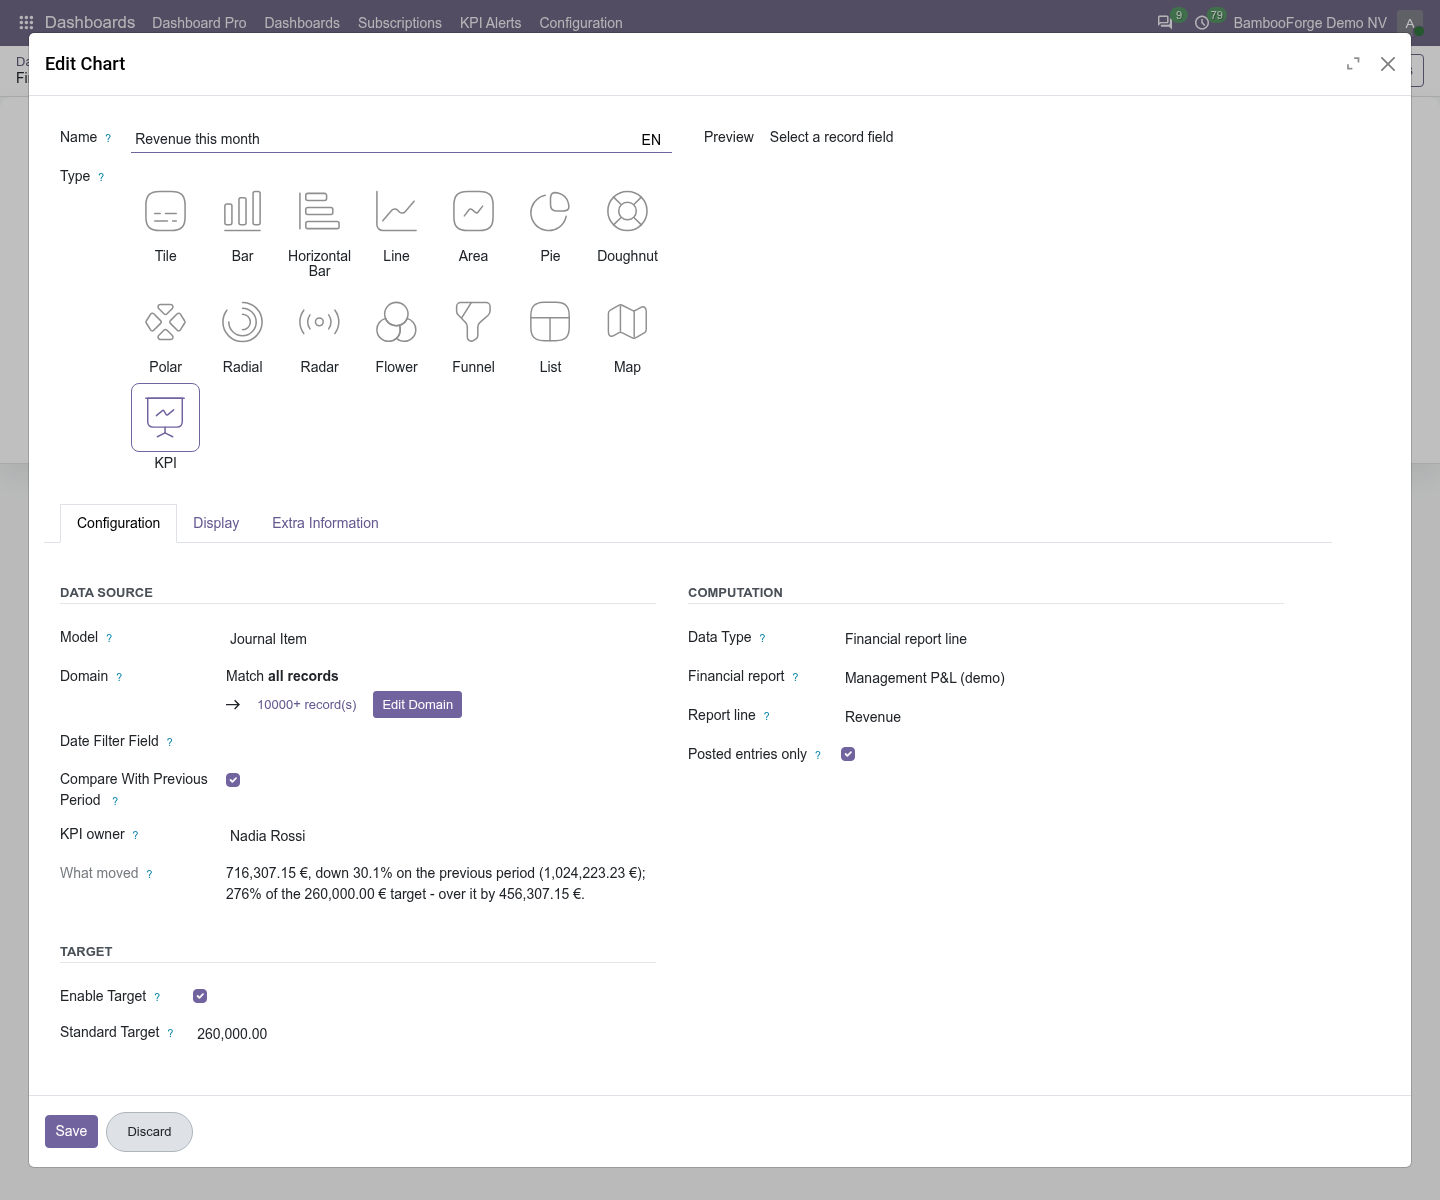
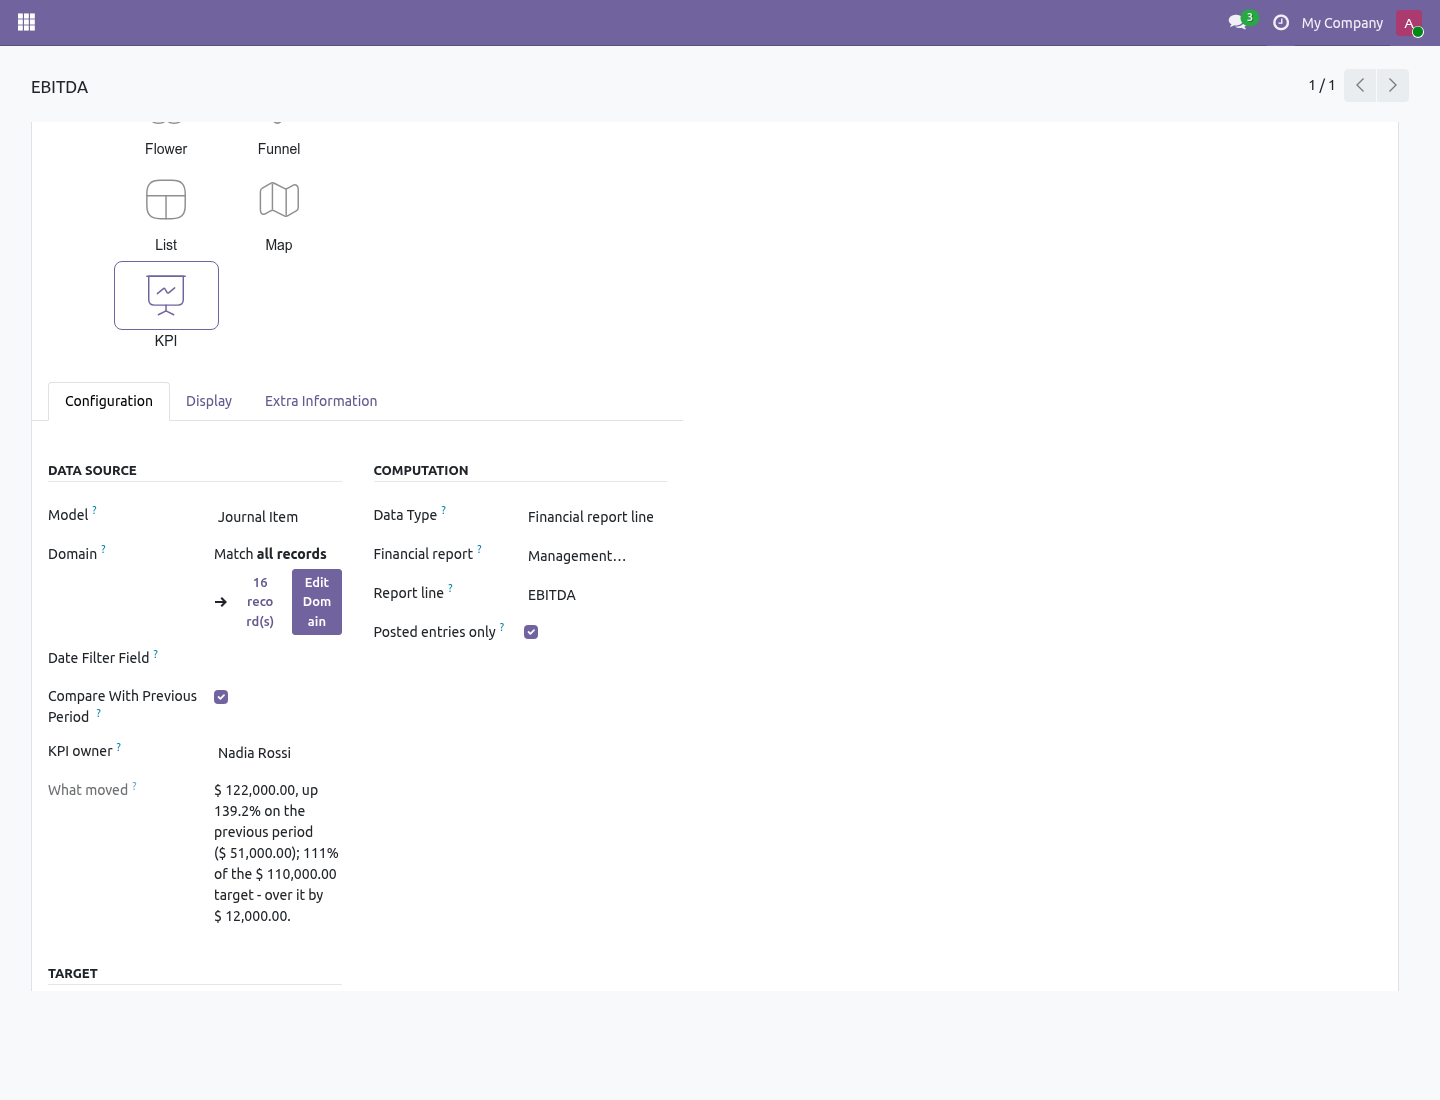
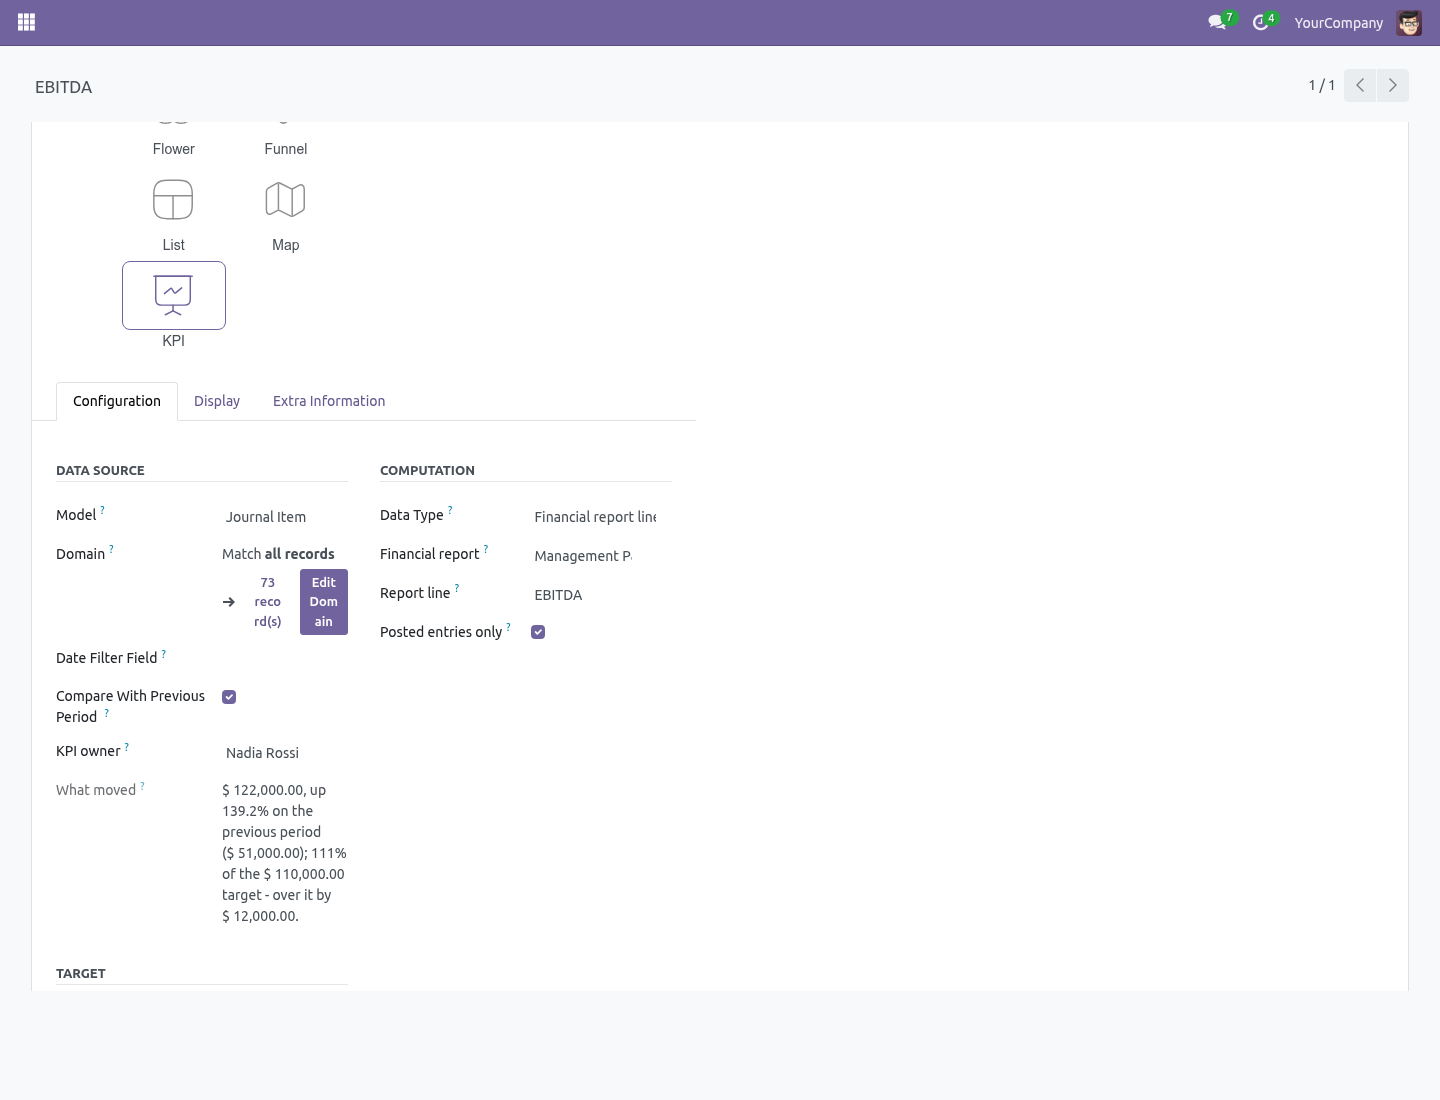
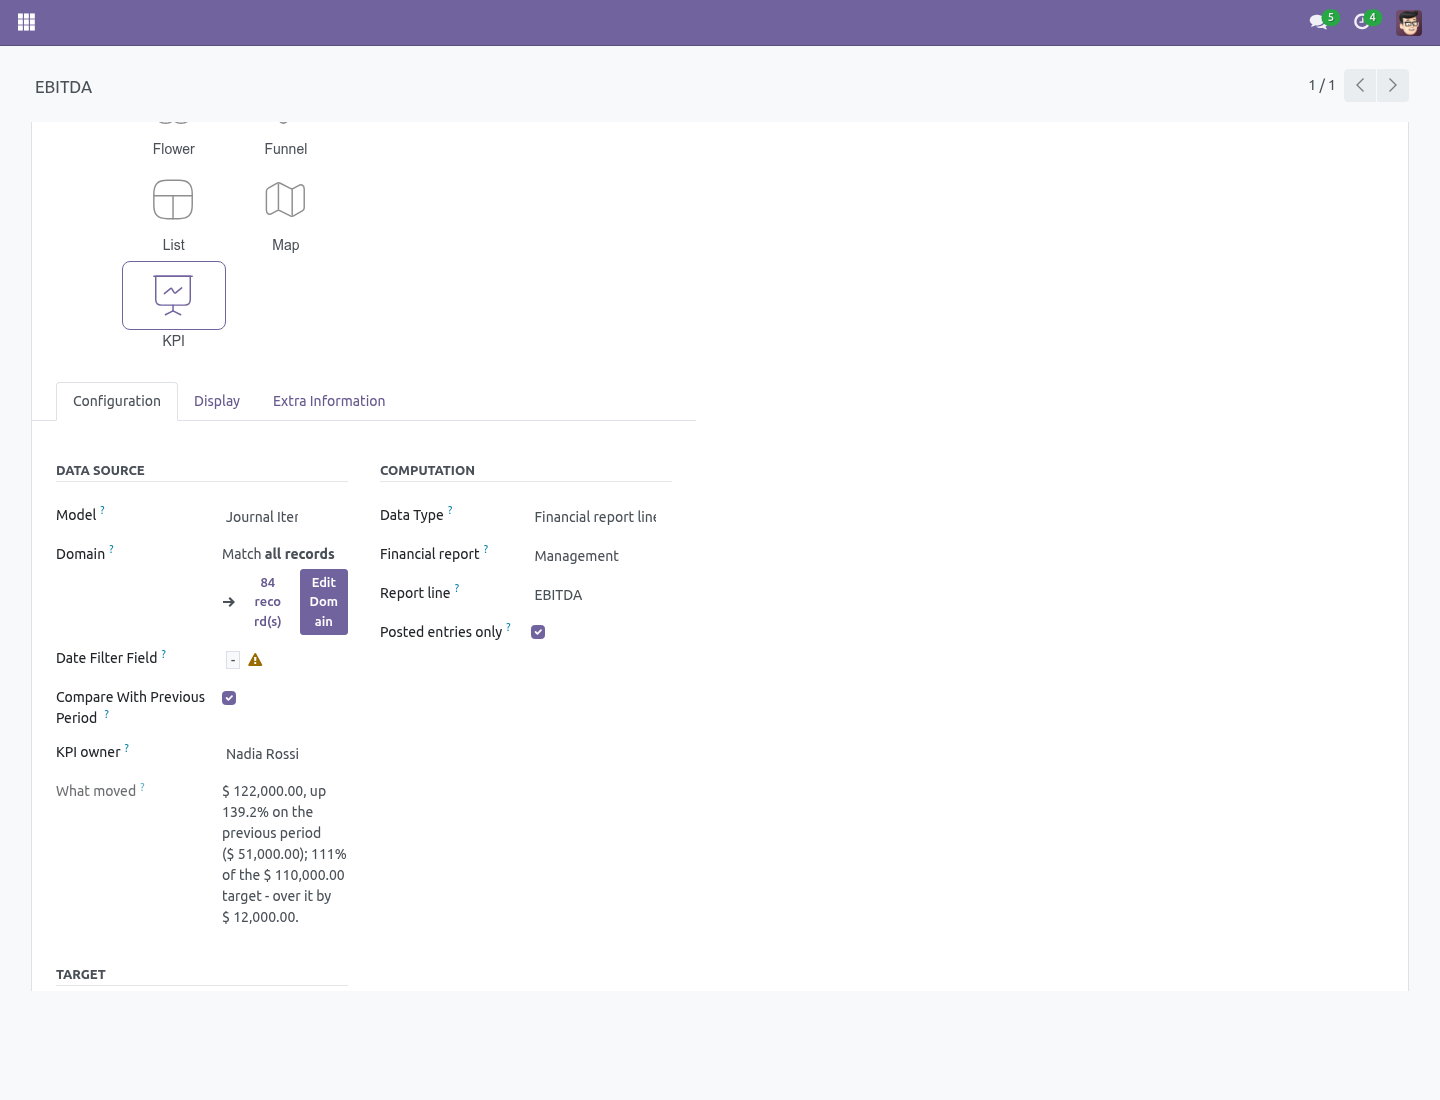
Build the statement in Accounting → Financial Reports if it is not there yet: a P&L with a Revenue line on prefix 70, a Result formula, whatever the owner reads. 2. Open the board, add a KPI (or a tile), and under Computation set Data Type to Financial report line. Pick the report and the line.
The model and the date field fill in by themselves. 3. Tick Posted entries only off if the board should read drafts too. 4.
Tick Compare With Previous Period and set a Target as usual. 5. Set the KPI owner. The board's date filter drives the period.
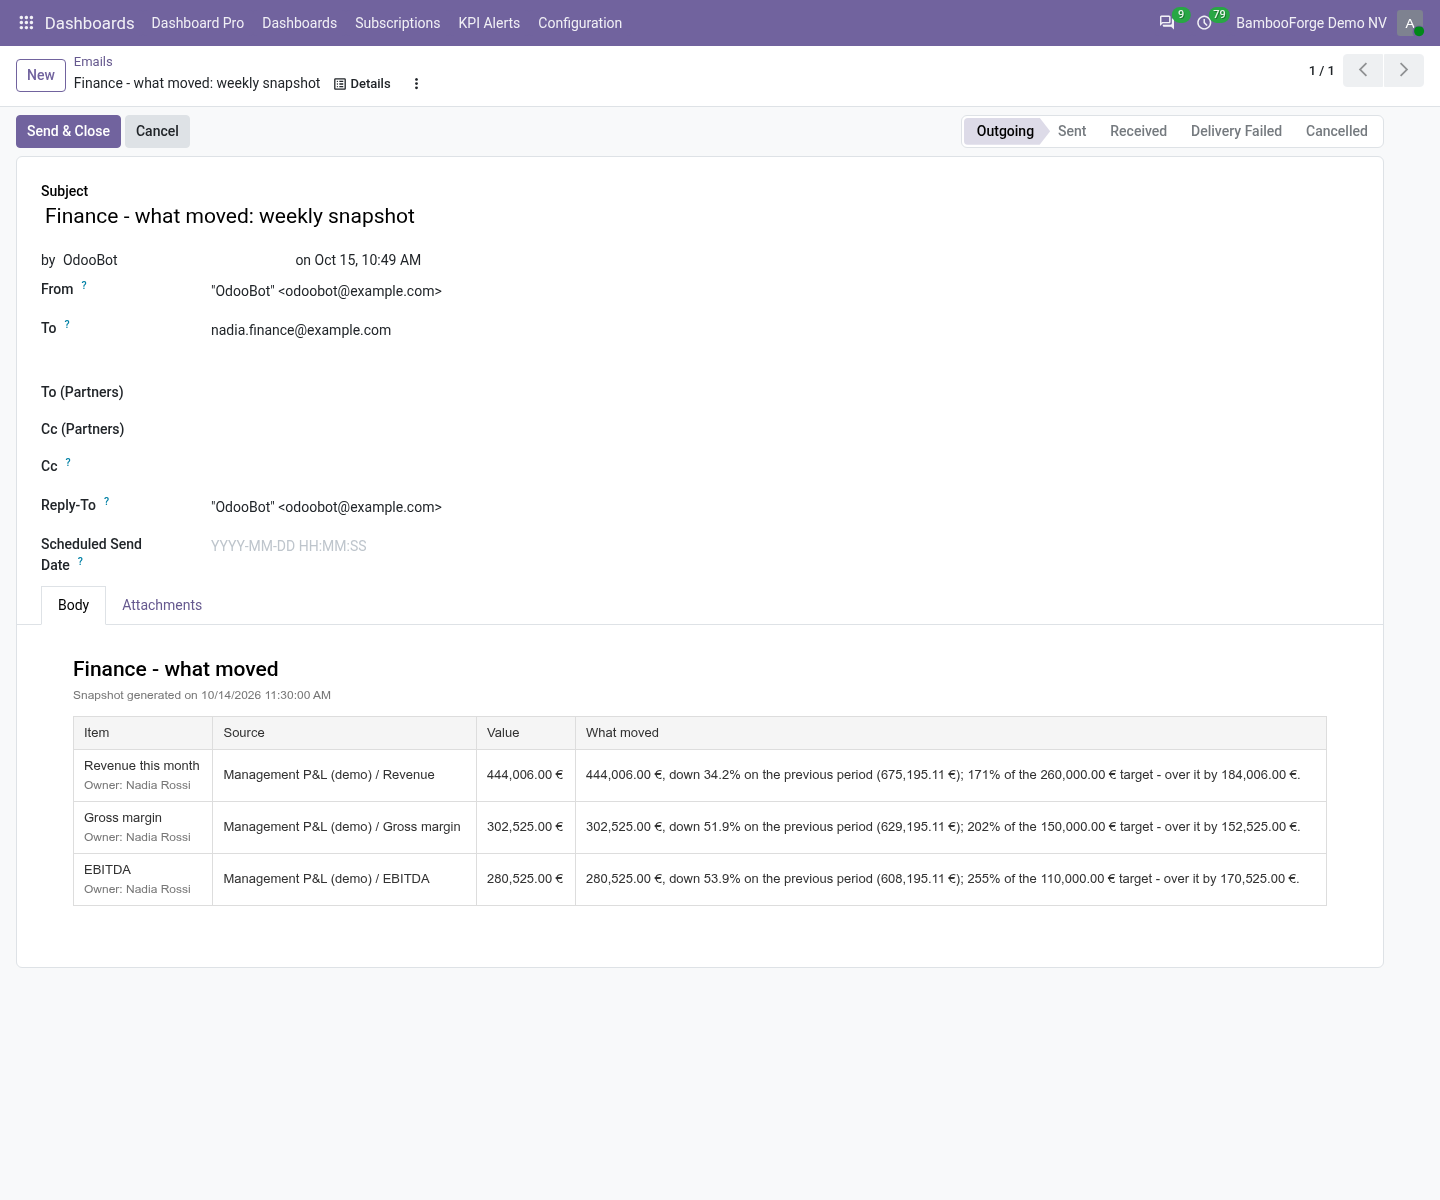
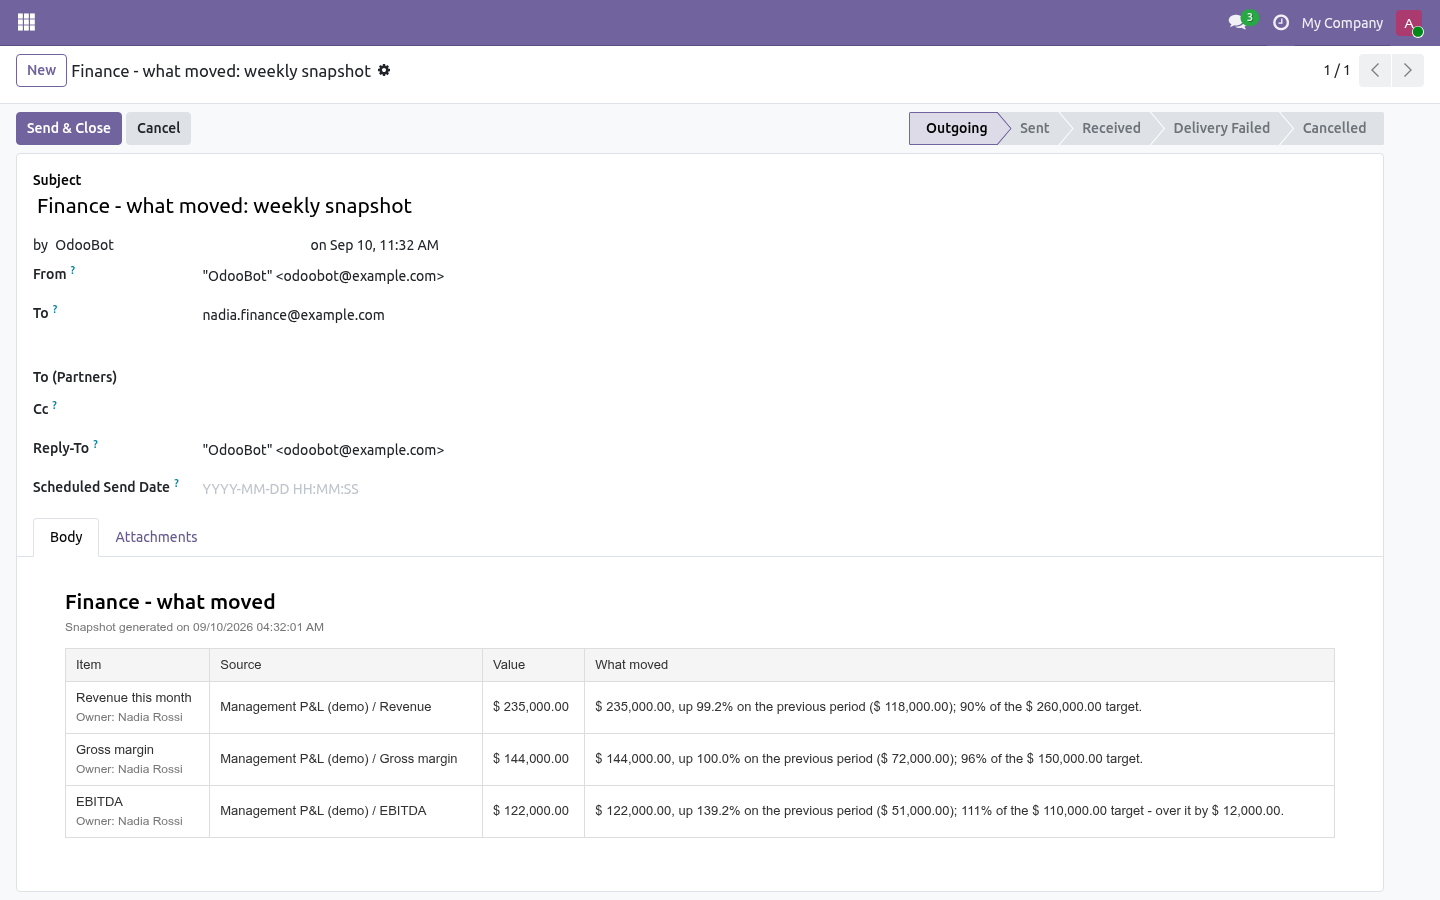
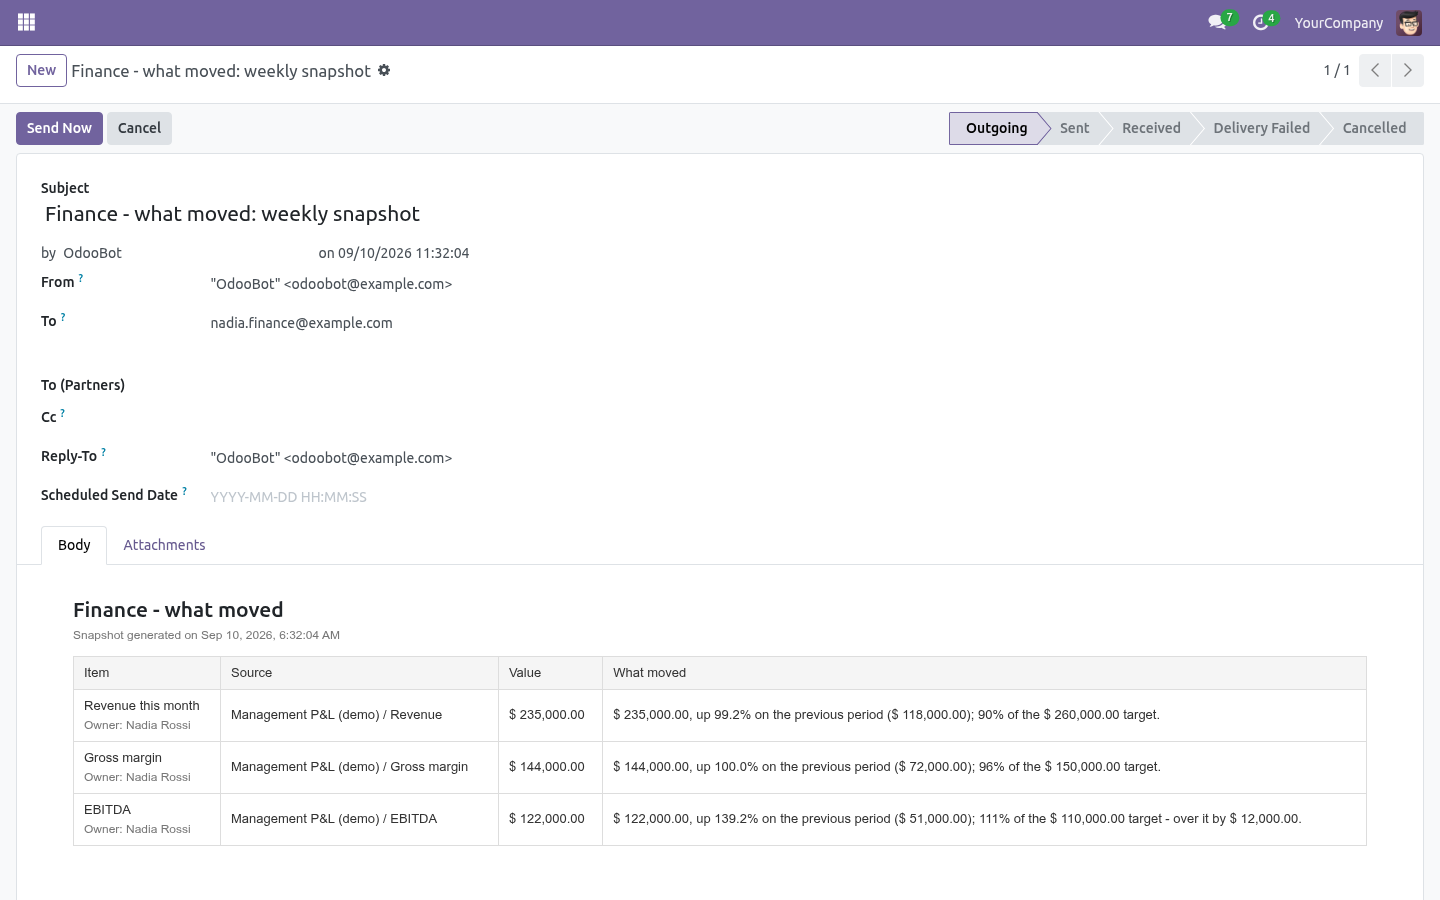
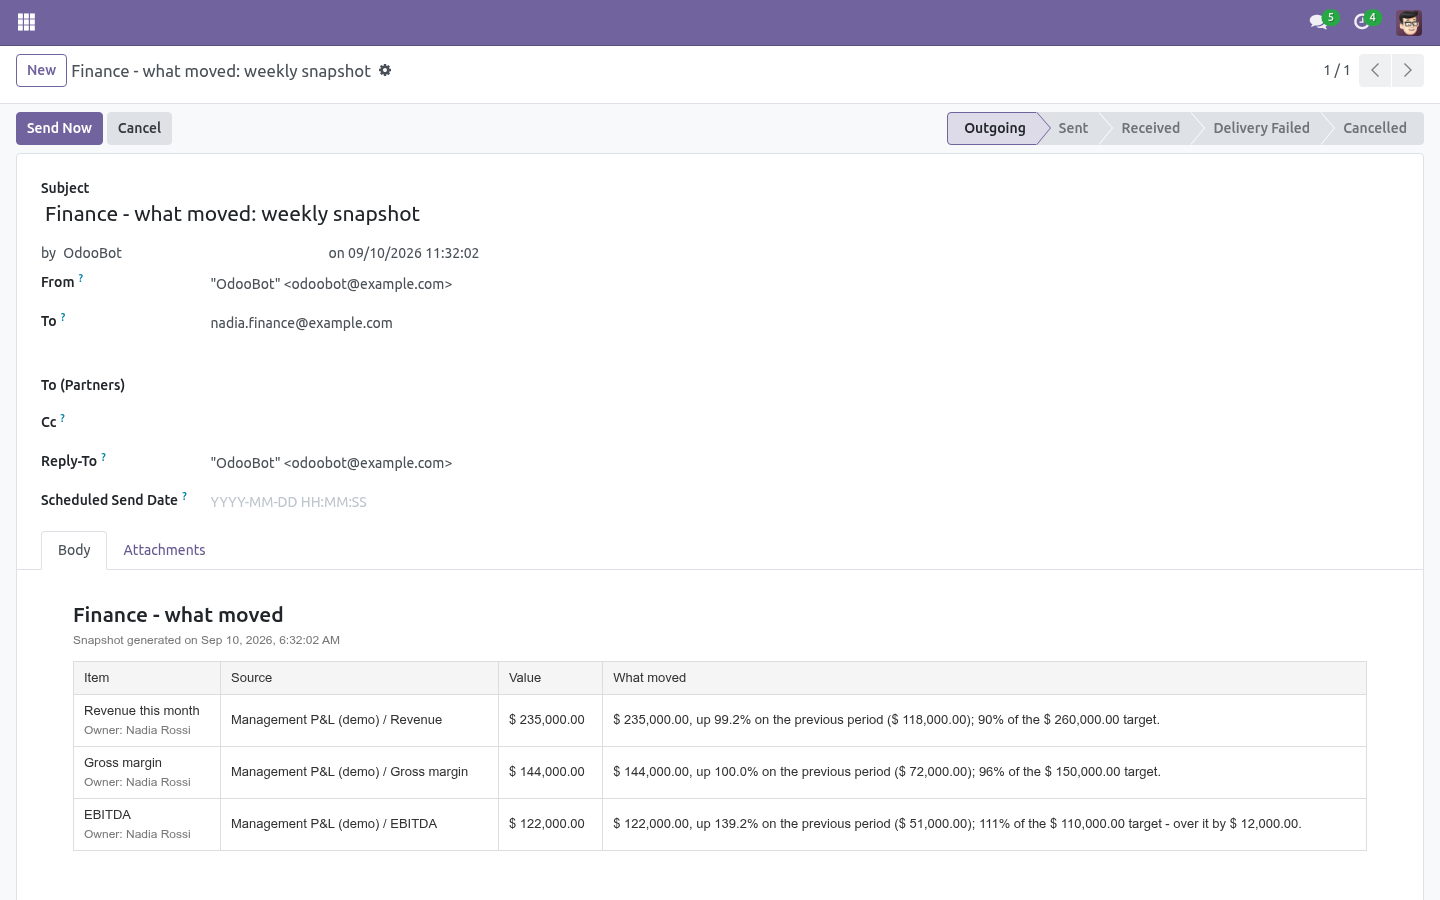
A KPI with its own date filter uses that instead; with no filter at all, the number is the fiscal year to date - a P&L since inception is not a figure anybody runs a business on. What moved. The sentence is built from what is known and nothing else: the value, formatted in the board's currency; if the comparison is on: up 12.5% on the previous period (EUR 1.20M), down, unchanged, or no previous-period figure to compare with; if a target is set: 90% of the EUR 1.50M target, or over it by EUR 120K. It shows on the KPI form under What moved, goes into every threshold alert e-mail on the item (with the owner named), and becomes a column of the scheduled snapshot - inline and in the PDF - so the Monday e-mail says which numbers moved, not only what they are.
How we make sure it works. Before every release, 17 automated checks run against this app on Odoo 17, 18, 19 and 20. Among them: No filter means fiscal year to date. Draft entries only when asked.
Line must belong to report. Narrative flat and no previous. Previous period same length before. The complete list is in the source you receive.
Now the part most videos leave out: what this does not do. The live tile on the board shows the number, the previous period and the target the way Dashboard Builder draws them; the sentence itself is on the form and in the e-mails, not painted on the tile. One line per tile. A chart over a statement is the report's own Run form, with its comparison column and drill-down.
Month to date compares with the month before, not with the same month last year; a year-on-year view is a second KPI with a custom range. The complete manual is at docs dot bambooforge dot dev, the demo database is linked from the store page, and support answers within twenty-four hours. Links are in the description.
Key facts
- What it is
- Put any line of a Financial Reports Builder statement on a Dashboard Builder board as a tile or KPI - gross margin, EBITDA, cash - with the board's own date filter, a previous-period comparison, a target, a named owner, and a sentence that says what moved, in the alert and in the weekly snapshot.
- For
- Accounting
- Odoo versions
- 17.0, 18.0, 19.0, 20.0 - Community and Enterprise
- Runs on
- Odoo.sh or Odoo you host yourself - not Odoo Online, which accepts no third-party apps
- Price
- 297 EUR, one-time, on the Odoo Apps Store
- Technical name
- bambooforge_dashboard_fin_reports
- Not for
- The live tile on the board shows the number, the previous period and the target the way Dashboard Builder draws them; the sentence itself is on the form and in the e-mails, not painted on the tile.; One line per tile. A chart over a statement is the report's own Run form, with its comparison column and drill-down.; Month to date compares with the month before, not with the same month last year; a year-on-year view is a second KPI with a custom range.
- Manual last updated
- 2026-09-23
Financial KPIs on the Dashboard
Dashboard Builder draws numbers from any model. Financial Reports Builder computes the numbers finance actually reports on. This bridge puts a statement line on a board - and tells you, in one sentence, what moved.
What you get
A new data type on a tile or a KPI: Financial report line. Pick a report and a line - a prefix line such as revenue, a type line such as cash, or a formula line such as EBITDA - and its amount is the number on the board.
The board's date filter is the report's period: month to date, last quarter, a custom range. A balance sheet line is read as at the end of the period, the way the report's own Run form does it.
Previous period and target work exactly as for any other KPI. Month to date compares with the same days of the month before, a quarter with the quarter before, a year with the year before; any other range with the same number of days ending the day before it.
A KPI owner: the person who answers for the number. Added to every alert on the item and named in the snapshot.
What moved: one sentence on the KPI form, in the threshold alert e-mail and in the scheduled snapshot - "EUR 1.35M, up 12.5% on the previous period (EUR 1.20M); 90% of the EUR 1.50M target."
Multi-currency: a report in another company's currency is converted to the board's currency at the period end.
Install
Needs Dashboard Builder and Financial Reports Builder, both by BambooForge; the store price of this page includes them. Install the bridge and the new data type appears on every tile and KPI form.
Putting a statement line on a board
Build the statement in Accounting → Financial Reports if it is not there yet: a P&L with a Revenue line on prefix 70, a Result formula, whatever the owner reads.
Open the board, add a KPI (or a tile), and under Computation set Data Type to Financial report line. Pick the report and the line. The model and the date field fill in by themselves.
Tick Posted entries only off if the board should read drafts too.
Tick Compare With Previous Period and set a Target as usual.
Set the KPI owner.
The board's date filter drives the period. A KPI with its own date filter uses that instead; with no filter at all, the number is the fiscal year to date - a P&L since inception is not a figure anybody runs a business on.
What moved
The sentence is built from what is known and nothing else:
the value, formatted in the board's currency;
if the comparison is on: up 12.5% on the previous period (EUR 1.20M), down, unchanged, or no previous-period figure to compare with;
if a target is set: 90% of the EUR 1.50M target, or over it by EUR 120K.
It shows on the KPI form under What moved, goes into every threshold alert e-mail on the item (with the owner named), and becomes a column of the scheduled snapshot - inline and in the PDF - so the Monday e-mail says which numbers moved, not only what they are.
Limits, stated plainly
The live tile on the board shows the number, the previous period and the target the way Dashboard Builder draws them; the sentence itself is on the form and in the e-mails, not painted on the tile.
One line per tile. A chart over a statement is the report's own Run form, with its comparison column and drill-down.
Month to date compares with the month before, not with the same month last year; a year-on-year view is a second KPI with a custom range.
How we make sure it works
Before every release, 17 automated checks run against this app on Odoo 17, 18, 19 and 20. Among them:
No filter means fiscal year to date.
Draft entries only when asked.
Line must belong to report.
Narrative flat and no previous.
Previous period same length before.
The complete list is in the source you receive.