 BambooForge Labs
Dashboard Builder: Drag-and-drop KPI Dashboards
Drag-and-drop KPI dashboards with charts and targets, threshold alerts that email the people who care, and scheduled PDF snapshots.
Available for Odoo 17.0, Odoo 18.0, Odoo 19.0, Odoo 20.0. Technical name bambooforge_dashboard.
Transcript of the walkthrough (Odoo 20)
Dashboard Builder: Drag-and-drop KPI Dashboards. Drag-and-drop KPI dashboards with charts and targets, threshold alerts that email the people who care, and scheduled PDF snapshots. BambooForge Dashboard turns any Odoo model into a visual dashboard. Each dashboard is a board that holds items; every item reads its own model, applies its own filter, and renders as a tile, a chart, a KPI, a list or a map.
You arrange the items on a drag-and-drop grid and save the layout. In the next few minutes: dashboard builder: drag-and-drop kpi dashboards, then step 1 — create a dashboard board, then step 2 — add a chart with the chart builder, then step 3 — set kpis and targets, then arrange & drag tiles. Then what this app deliberately does not do, so you can tell before you buy whether it fits. Everything lives under Dashboard Pro then Subscriptions then KPI Alerts then Dashboard Pro.
Dashboard Builder: Drag-and-drop KPI Dashboards. Build live operational dashboards inside Odoo 20 without writing code: drop in tiles, charts, KPIs and lists that read straight from any Odoo model, group and measure the data the way you want, drag the tiles into place, then set targets and share the board with the right people. This page is the complete manual. If you follow it top to bottom you can install the app, build your first dashboard, add a chart with the chart builder, set KPIs and targets, share the board, and fix the common issues without contacting support.
Step 1 — Create a dashboard board. 1. Open Dashboards ▸ Dashboard Pro. You see the boards as kanban cards.
2. Click New and fill in the board form: 3. Click Save, then View (header button) to open the live dashboard. Step 2 — Add a chart with the chart builder.
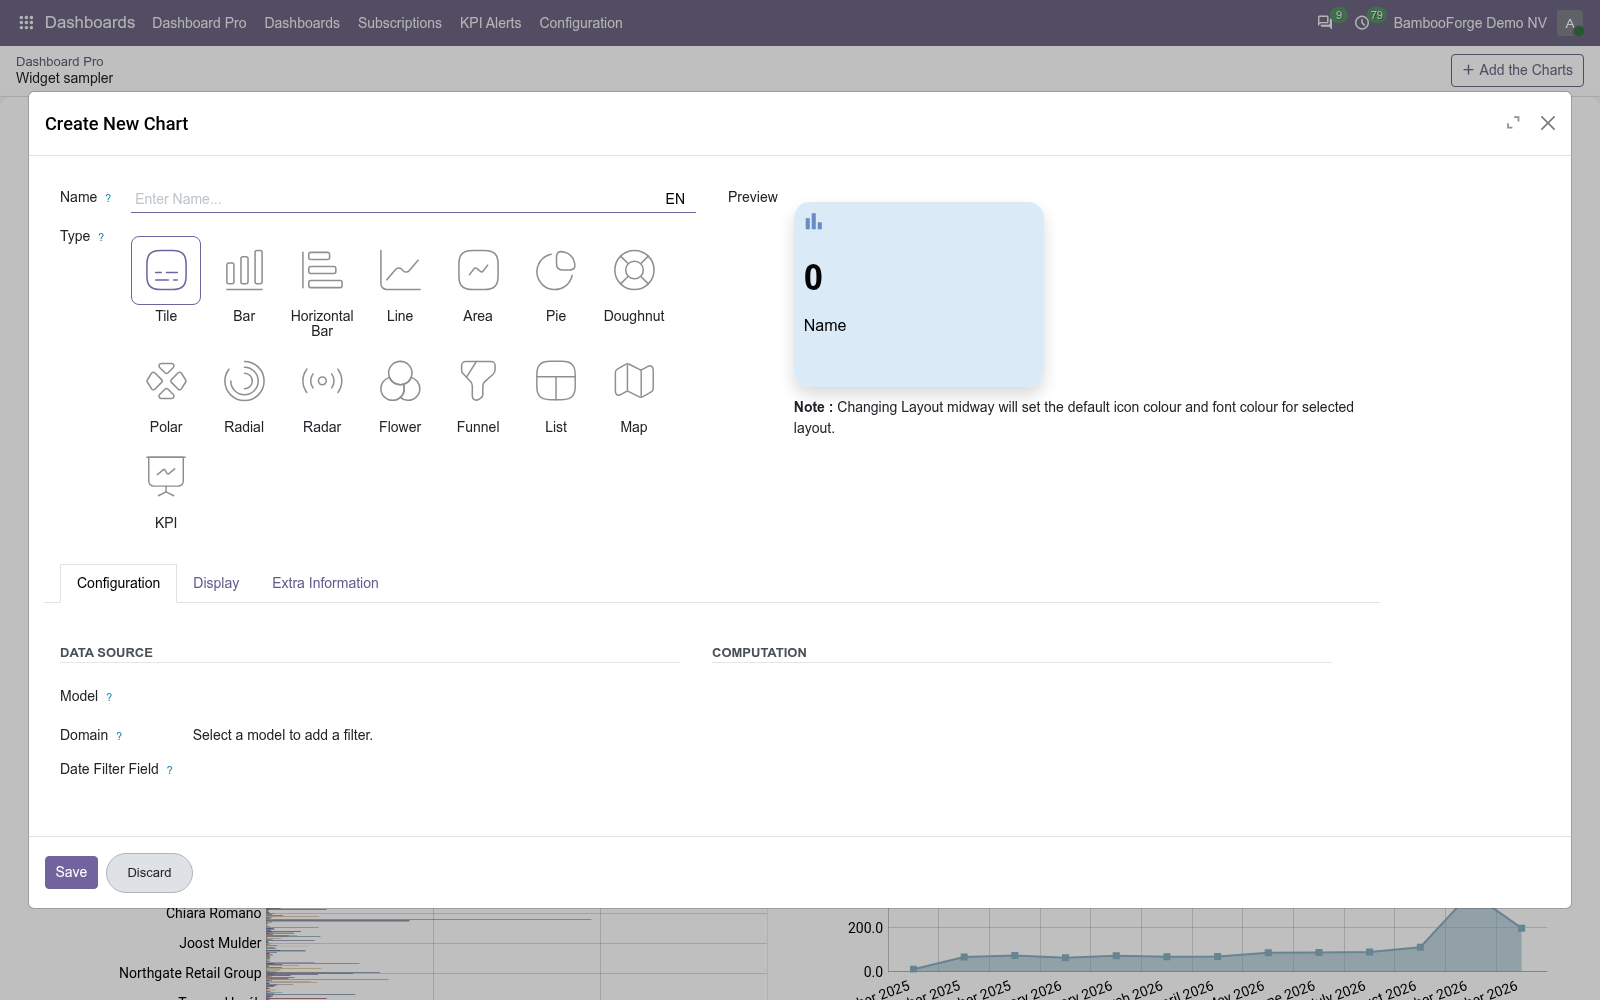
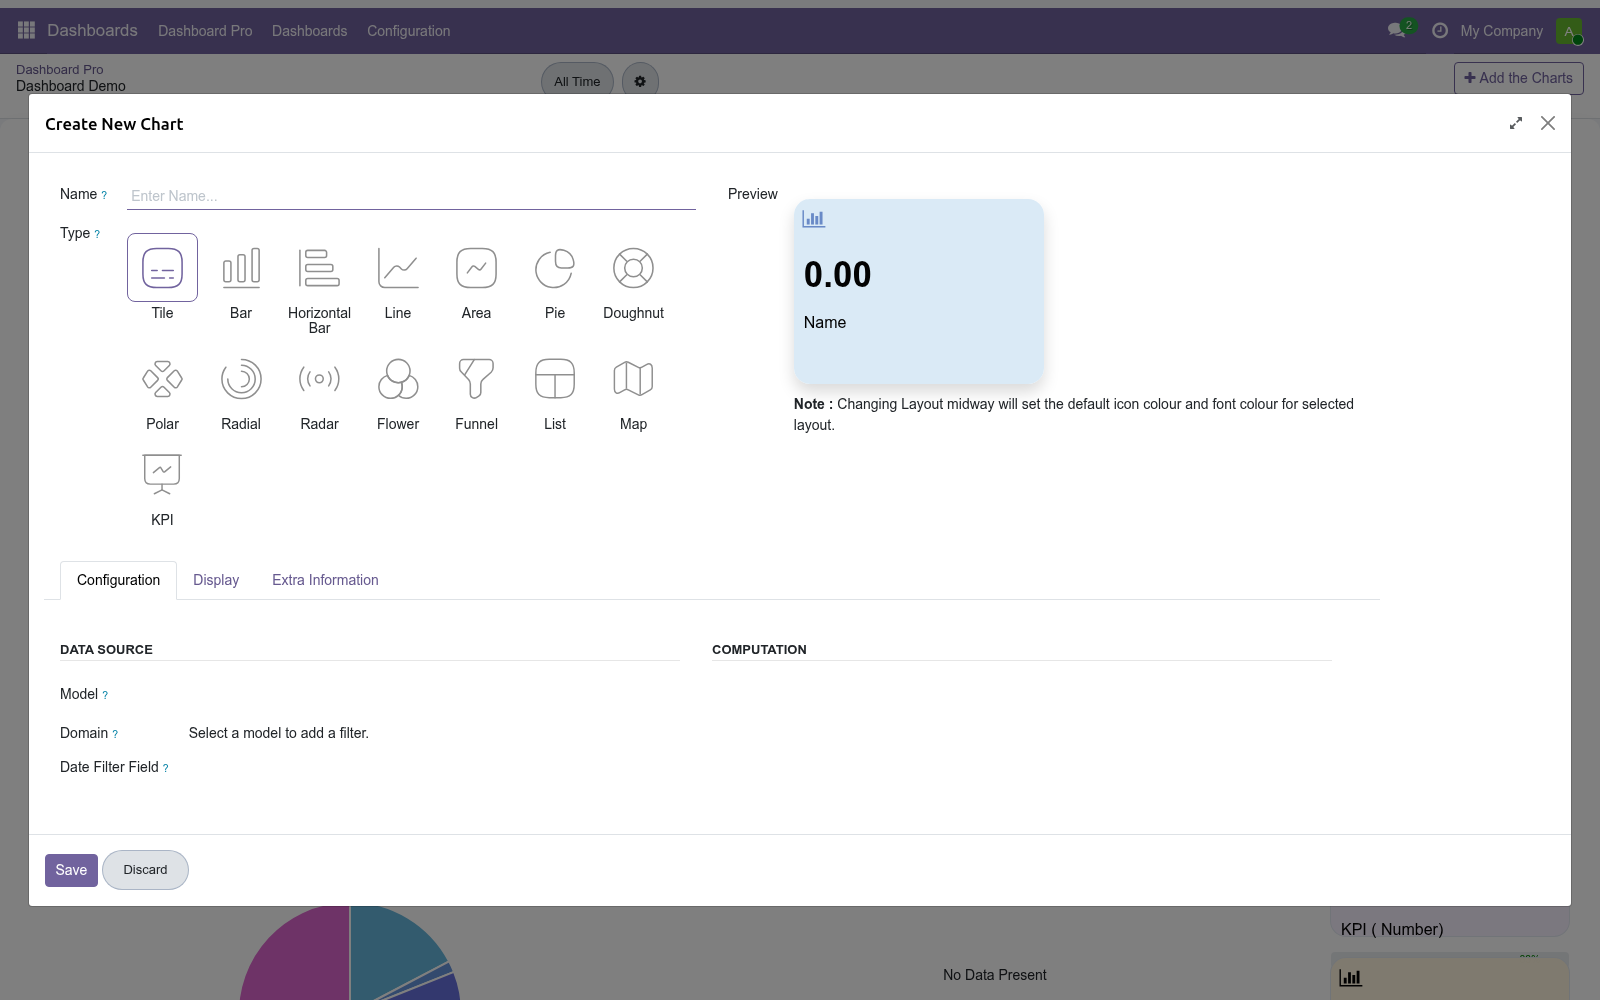
On the open dashboard, as a Dashboard Manager you get an Add the Charts button (the + in the control panel). Click it to open the item builder form. 1. Name — a unique label for the item.
2. Type — pick the item type. The live preview on the right updates as you configure the rest. Available types: Step 3 — Set KPIs and targets.
KPI item. Choose Type = KPI, pick a Model, Data Type and (for sum/average) a Measure. In the Target group: Tick Enable Target and enter a Standard Target value — the KPI shows the headline number against that target. Or tick Compare With Previous Period (in the KPI Data Source group) to show the current value next to the same metric for the previous period (Week/Month/Quarter/Year to Date map to last week/month/quarter/year).
A Standard Target value plots a flat target series across every bar/point. Show it as an extra bar, or as an overlaid line by enabling Show Target As Line. Dated target lines (per-date goals) apply when the chart is grouped by a date field: each goal has a Date and a Value, and the targets are matched to the matching time buckets of the chart. When dated target lines are in use, the list/pagination limit is managed automatically.
Chart targets. Bar, horizontal bar, line and area charts can show a target too: Arrange & drag tiles. Open a board and, as a Dashboard Manager, choose Edit Layout from the gear (cog) menu. The grid becomes draggable (it uses a gridstack grid): 1.
Drag any tile to move it; drag its corner to resize it. 2. Click Save Layout to persist the arrangement, or Discard to revert. Quick-customise, move, duplicate, delete items.
Hover an item to reveal its toolbar (manager only): the pencil opens a quick-customise popup for that item's type and look, the i shows its description, and the bin removes it. You can also Move an item to another board or Duplicate it across boards from the item actions. Date filter, refresh & export. The control panel carries the board's date filter; changing it re-reads every item for the new period.
From the gear menu a manager can Send by Email (uses the bundled Dashboard Report mail template), Print PDF, or Capture Dashboard (saves a board image used on the kanban card). Sharing & access rights. Who can see a board is controlled by Allowed Groups on the board form: Blank — every internal user can open the board and its items. One or more groups — only users in those groups can open it; the app enforces this with record rules on both the board and its items, so a restricted board's charts, measures and data are not even readable by users outside the groups.
Who can build is fixed by Odoo groups: only Dashboard Managers create/edit/delete; everyone else is view-only. Use Show Under Menu to surface a board as a link beneath the menus where your users already work. Customization Look — per item: background and font colour (with transparency), a built-in icon or an uploaded image, six tile layouts, decimal places, and a custom unit (monetary symbol or a short text unit, max 5 characters). Computation — beyond count/sum/average, the Python Code data type lets you compute a value per group from the matching records recordset (e.g.
ratios across related models). The expression runs in Odoo's safe-eval sandbox. Click-through — enable Show Records so clicking an item opens the underlying Odoo records, or attach an Item Action (an existing window action on the same model) to jump to a specific view. Grouping — single or two-level grouping; date group-bys at Day/Week/Month/Quarter/Year; cumulative line on date-grouped charts; fill-temporal to show empty periods.
Frequently asked questions. Which Odoo versions are supported? Odoo 20.0, Community or Enterprise. The app depends on the standard Spreadsheet Dashboard and Geolocalization modules, which ship with Odoo.
Do I need to write code? No. Tiles, charts, KPIs, lists and maps are built entirely from the form by picking a model, a measure and a group-by. The optional Python Code data type is there only if you want a computed value; everything else is point-and-click.
Now the part most videos leave out: what this does not do. The app reads from the Odoo models you point each item at, using the viewing user's own access rights and the active company; it does not send data outside your Odoo instance. Multi-company is respected: boards and items are scoped to companies via record rules. Board visibility is enforced by Allowed Groups plus record rules on both boards and items.
Limits: each chart is capped at 500 group-by buckets for performance, so a very high-cardinality group-by is truncated — group by a coarser field instead. The Map view plots partners that have geolocation coordinates. Targets render on bar/horizontal-bar/ line/area charts and KPIs only. The complete manual is at docs dot bambooforge dot dev, the demo database is linked from the store page, and support answers within twenty-four hours.
Links are in the description.
Transcript of the walkthrough (Odoo 19)
Dashboard Builder: Drag-and-drop KPI Dashboards. Drag-and-drop KPI dashboards with charts and targets, threshold alerts that email the people who care, and scheduled PDF snapshots. BambooForge Dashboard turns any Odoo model into a visual dashboard. Each dashboard is a board that holds items; every item reads its own model, applies its own filter, and renders as a tile, a chart, a KPI, a list or a map.
You arrange the items on a drag-and-drop grid and save the layout. In the next few minutes: dashboard builder: drag-and-drop kpi dashboards, then step 1 — create a dashboard board, then step 2 — add a chart with the chart builder, then step 3 — set kpis and targets, then arrange & drag tiles. Then what this app deliberately does not do, so you can tell before you buy whether it fits. Everything lives under Dashboard Pro then Subscriptions then KPI Alerts then Dashboard Pro.
Dashboard Builder: Drag-and-drop KPI Dashboards. Build live operational dashboards inside Odoo 19 without writing code: drop in tiles, charts, KPIs and lists that read straight from any Odoo model, group and measure the data the way you want, drag the tiles into place, then set targets and share the board with the right people. This page is the complete manual. If you follow it top to bottom you can install the app, build your first dashboard, add a chart with the chart builder, set KPIs and targets, share the board, and fix the common issues without contacting support.
Step 1 — Create a dashboard board. 1. Open Dashboards ▸ Dashboard Pro. You see the boards as kanban cards.
2. Click New and fill in the board form: 3. Click Save, then View (header button) to open the live dashboard. Step 2 — Add a chart with the chart builder.
On the open dashboard, as a Dashboard Manager you get an Add the Charts button (the + in the control panel). Click it to open the item builder form. 1. Name — a unique label for the item.
2. Type — pick the item type. The live preview on the right updates as you configure the rest. Available types: Step 3 — Set KPIs and targets.
KPI item. Choose Type = KPI, pick a Model, Data Type and (for sum/average) a Measure. In the Target group: Tick Enable Target and enter a Standard Target value — the KPI shows the headline number against that target. Or tick Compare With Previous Period (in the KPI Data Source group) to show the current value next to the same metric for the previous period (Week/Month/Quarter/Year to Date map to last week/month/quarter/year).
A Standard Target value plots a flat target series across every bar/point. Show it as an extra bar, or as an overlaid line by enabling Show Target As Line. Dated target lines (per-date goals) apply when the chart is grouped by a date field: each goal has a Date and a Value, and the targets are matched to the matching time buckets of the chart. When dated target lines are in use, the list/pagination limit is managed automatically.
Chart targets. Bar, horizontal bar, line and area charts can show a target too: Arrange & drag tiles. Open a board and, as a Dashboard Manager, choose Edit Layout from the gear (cog) menu. The grid becomes draggable (it uses a gridstack grid): 1.
Drag any tile to move it; drag its corner to resize it. 2. Click Save Layout to persist the arrangement, or Discard to revert. Quick-customise, move, duplicate, delete items.
Hover an item to reveal its toolbar (manager only): the pencil opens a quick-customise popup for that item's type and look, the i shows its description, and the bin removes it. You can also Move an item to another board or Duplicate it across boards from the item actions. Date filter, refresh & export. The control panel carries the board's date filter; changing it re-reads every item for the new period.
From the gear menu a manager can Send by Email (uses the bundled Dashboard Report mail template), Print PDF, or Capture Dashboard (saves a board image used on the kanban card). Sharing & access rights. Who can see a board is controlled by Allowed Groups on the board form: Blank — every internal user can open the board and its items. One or more groups — only users in those groups can open it; the app enforces this with record rules on both the board and its items, so a restricted board's charts, measures and data are not even readable by users outside the groups.
Who can build is fixed by Odoo groups: only Dashboard Managers create/edit/delete; everyone else is view-only. Use Show Under Menu to surface a board as a link beneath the menus where your users already work. Customization Look — per item: background and font colour (with transparency), a built-in icon or an uploaded image, six tile layouts, decimal places, and a custom unit (monetary symbol or a short text unit, max 5 characters). Computation — beyond count/sum/average, the Python Code data type lets you compute a value per group from the matching records recordset (e.g.
ratios across related models). The expression runs in Odoo's safe-eval sandbox. Click-through — enable Show Records so clicking an item opens the underlying Odoo records, or attach an Item Action (an existing window action on the same model) to jump to a specific view. Grouping — single or two-level grouping; date group-bys at Day/Week/Month/Quarter/Year; cumulative line on date-grouped charts; fill-temporal to show empty periods.
Troubleshooting Now the part most videos leave out: what this does not do. The app reads from the Odoo models you point each item at, using the viewing user's own access rights and the active company; it does not send data outside your Odoo instance. Multi-company is respected: boards and items are scoped to companies via record rules. Board visibility is enforced by Allowed Groups plus record rules on both boards and items.
Limits: each chart is capped at 500 group-by buckets for performance, so a very high-cardinality group-by is truncated — group by a coarser field instead. The Map view plots partners that have geolocation coordinates. Targets render on bar/horizontal-bar/ line/area charts and KPIs only. The complete manual is at docs dot bambooforge dot dev, the demo database is linked from the store page, and support answers within twenty-four hours.
Links are in the description.
Transcript of the walkthrough (Odoo 18)
Dashboard Builder: Drag-and-drop KPI Dashboards. Drag-and-drop KPI dashboards with charts and targets, threshold alerts that email the people who care, and scheduled PDF snapshots. BambooForge Dashboard turns any Odoo model into a visual dashboard. Each dashboard is a board that holds items; every item reads its own model, applies its own filter, and renders as a tile, a chart, a KPI, a list or a map.
You arrange the items on a drag-and-drop grid and save the layout. In the next few minutes: dashboard builder: drag-and-drop kpi dashboards, then step 1 — create a dashboard board, then step 2 — add a chart with the chart builder, then step 3 — set kpis and targets, then arrange & drag tiles. Then what this app deliberately does not do, so you can tell before you buy whether it fits. Everything lives under Dashboard Pro then Subscriptions then KPI Alerts then Dashboard Pro.
Dashboard Builder: Drag-and-drop KPI Dashboards. Build live operational dashboards inside Odoo 18 without writing code: drop in tiles, charts, KPIs and lists that read straight from any Odoo model, group and measure the data the way you want, drag the tiles into place, then set targets and share the board with the right people. This page is the complete manual. If you follow it top to bottom you can install the app, build your first dashboard, add a chart with the chart builder, set KPIs and targets, share the board, and fix the common issues without contacting support.
Step 1 — Create a dashboard board. 1. Open Dashboards ▸ Dashboard Pro. You see the boards as kanban cards.
2. Click New and fill in the board form: 3. Click Save, then View (header button) to open the live dashboard. Step 2 — Add a chart with the chart builder.
On the open dashboard, as a Dashboard Manager you get an Add the Charts button (the + in the control panel). Click it to open the item builder form. 1. Name — a unique label for the item.
2. Type — pick the item type. The live preview on the right updates as you configure the rest. Available types: Step 3 — Set KPIs and targets.
KPI item. Choose Type = KPI, pick a Model, Data Type and (for sum/average) a Measure. In the Target group: Tick Enable Target and enter a Standard Target value — the KPI shows the headline number against that target. Or tick Compare With Previous Period (in the KPI Data Source group) to show the current value next to the same metric for the previous period (Week/Month/Quarter/Year to Date map to last week/month/quarter/year).
A Standard Target value plots a flat target series across every bar/point. Show it as an extra bar, or as an overlaid line by enabling Show Target As Line. Dated target lines (per-date goals) apply when the chart is grouped by a date field: each goal has a Date and a Value, and the targets are matched to the matching time buckets of the chart. When dated target lines are in use, the list/pagination limit is managed automatically.
Chart targets. Bar, horizontal bar, line and area charts can show a target too: Arrange & drag tiles. Open a board and, as a Dashboard Manager, choose Edit Layout from the gear (cog) menu. The grid becomes draggable (it uses a gridstack grid): 1.
Drag any tile to move it; drag its corner to resize it. 2. Click Save Layout to persist the arrangement, or Discard to revert. Quick-customise, move, duplicate, delete items.
Hover an item to reveal its toolbar (manager only): the pencil opens a quick-customise popup for that item's type and look, the i shows its description, and the bin removes it. You can also Move an item to another board or Duplicate it across boards from the item actions. Date filter, refresh & export. The control panel carries the board's date filter; changing it re-reads every item for the new period.
From the gear menu a manager can Send by Email (uses the bundled Dashboard Report mail template), Print PDF, or Capture Dashboard (saves a board image used on the kanban card). Sharing & access rights. Who can see a board is controlled by Allowed Groups on the board form: Blank — every internal user can open the board and its items. One or more groups — only users in those groups can open it; the app enforces this with record rules on both the board and its items, so a restricted board's charts, measures and data are not even readable by users outside the groups.
Who can build is fixed by Odoo groups: only Dashboard Managers create/edit/delete; everyone else is view-only. Use Show Under Menu to surface a board as a link beneath the menus where your users already work. Customization Look — per item: background and font colour (with transparency), a built-in icon or an uploaded image, six tile layouts, decimal places, and a custom unit (monetary symbol or a short text unit, max 5 characters). Computation — beyond count/sum/average, the Python Code data type lets you compute a value per group from the matching records recordset (e.g.
ratios across related models). The expression runs in Odoo's safe-eval sandbox. Click-through — enable Show Records so clicking an item opens the underlying Odoo records, or attach an Item Action (an existing window action on the same model) to jump to a specific view. Grouping — single or two-level grouping; date group-bys at Day/Week/Month/Quarter/Year; cumulative line on date-grouped charts; fill-temporal to show empty periods.
Troubleshooting Now the part most videos leave out: what this does not do. The app reads from the Odoo models you point each item at, using the viewing user's own access rights and the active company; it does not send data outside your Odoo instance. Multi-company is respected: boards and items are scoped to companies via record rules. Board visibility is enforced by Allowed Groups plus record rules on both boards and items.
Limits: each chart is capped at 500 group-by buckets for performance, so a very high-cardinality group-by is truncated — group by a coarser field instead. The Map view plots partners that have geolocation coordinates. Targets render on bar/horizontal-bar/ line/area charts and KPIs only. The complete manual is at docs dot bambooforge dot dev, the demo database is linked from the store page, and support answers within twenty-four hours.
Links are in the description.
Transcript of the walkthrough (Odoo 17)
Dashboard Builder: Drag-and-drop KPI Dashboards. Drag-and-drop KPI dashboards with charts and targets, threshold alerts that email the people who care, and scheduled PDF snapshots. BambooForge Dashboard turns any Odoo model into a visual dashboard. Each dashboard is a board that holds items; every item reads its own model, applies its own filter, and renders as a tile, a chart, a KPI, a list or a map.
You arrange the items on a drag-and-drop grid and save the layout. In the next few minutes: dashboard builder: drag-and-drop kpi dashboards, then step 1 — create a dashboard board, then step 2 — add a chart with the chart builder, then step 3 — set kpis and targets, then arrange & drag tiles. Then what this app deliberately does not do, so you can tell before you buy whether it fits. Everything lives under Dashboard Pro then Subscriptions then KPI Alerts then Dashboard Pro.
Dashboard Builder: Drag-and-drop KPI Dashboards. Build live operational dashboards inside Odoo 17 without writing code: drop in tiles, charts, KPIs and lists that read straight from any Odoo model, group and measure the data the way you want, drag the tiles into place, then set targets and share the board with the right people. This page is the complete manual. If you follow it top to bottom you can install the app, build your first dashboard, add a chart with the chart builder, set KPIs and targets, share the board, and fix the common issues without contacting support.
Step 1 — Create a dashboard board. 1. Open Dashboards ▸ Dashboard Pro. You see the boards as kanban cards.
2. Click New and fill in the board form: 3. Click Save, then View (header button) to open the live dashboard. Step 2 — Add a chart with the chart builder.
On the open dashboard, as a Dashboard Manager you get an Add the Charts button (the + in the control panel). Click it to open the item builder form. 1. Name — a unique label for the item.
2. Type — pick the item type. The live preview on the right updates as you configure the rest. Available types: Step 3 — Set KPIs and targets.
KPI item. Choose Type = KPI, pick a Model, Data Type and (for sum/average) a Measure. In the Target group: Tick Enable Target and enter a Standard Target value — the KPI shows the headline number against that target. Or tick Compare With Previous Period (in the KPI Data Source group) to show the current value next to the same metric for the previous period (Week/Month/Quarter/Year to Date map to last week/month/quarter/year).
A Standard Target value plots a flat target series across every bar/point. Show it as an extra bar, or as an overlaid line by enabling Show Target As Line. Dated target lines (per-date goals) apply when the chart is grouped by a date field: each goal has a Date and a Value, and the targets are matched to the matching time buckets of the chart. When dated target lines are in use, the list/pagination limit is managed automatically.
Chart targets. Bar, horizontal bar, line and area charts can show a target too: Arrange & drag tiles. Open a board and, as a Dashboard Manager, choose Edit Layout from the gear (cog) menu. The grid becomes draggable (it uses a gridstack grid): 1.
Drag any tile to move it; drag its corner to resize it. 2. Click Save Layout to persist the arrangement, or Discard to revert. Quick-customise, move, duplicate, delete items.
Hover an item to reveal its toolbar (manager only): the pencil opens a quick-customise popup for that item's type and look, the i shows its description, and the bin removes it. You can also Move an item to another board or Duplicate it across boards from the item actions. Date filter, refresh & export. The control panel carries the board's date filter; changing it re-reads every item for the new period.
From the gear menu a manager can Send by Email (uses the bundled Dashboard Report mail template), Print PDF, or Capture Dashboard (saves a board image used on the kanban card). Sharing & access rights. Who can see a board is controlled by Allowed Groups on the board form: Blank — every internal user can open the board and its items. One or more groups — only users in those groups can open it; the app enforces this with record rules on both the board and its items, so a restricted board's charts, measures and data are not even readable by users outside the groups.
Who can build is fixed by Odoo groups: only Dashboard Managers create/edit/delete; everyone else is view-only. Use Show Under Menu to surface a board as a link beneath the menus where your users already work. Customization Look — per item: background and font colour (with transparency), a built-in icon or an uploaded image, six tile layouts, decimal places, and a custom unit (monetary symbol or a short text unit, max 5 characters). Computation — beyond count/sum/average, the Python Code data type lets you compute a value per group from the matching records recordset (e.g.
ratios across related models). The expression runs in Odoo's safe-eval sandbox. Click-through — enable Show Records so clicking an item opens the underlying Odoo records, or attach an Item Action (an existing window action on the same model) to jump to a specific view. Grouping — single or two-level grouping; date group-bys at Day/Week/Month/Quarter/Year; cumulative line on date-grouped charts; fill-temporal to show empty periods.
Troubleshooting Now the part most videos leave out: what this does not do. The app reads from the Odoo models you point each item at, using the viewing user's own access rights and the active company; it does not send data outside your Odoo instance. Multi-company is respected: boards and items are scoped to companies via record rules. Board visibility is enforced by Allowed Groups plus record rules on both boards and items.
Limits: each chart is capped at 500 group-by buckets for performance, so a very high-cardinality group-by is truncated — group by a coarser field instead. The Map view plots partners that have geolocation coordinates. Targets render on bar/horizontal-bar/ line/area charts and KPIs only. The complete manual is at docs dot bambooforge dot dev, the demo database is linked from the store page, and support answers within twenty-four hours.
Links are in the description.
Key facts
- What it is
- Drag-and-drop KPI dashboards with charts and targets, threshold alerts that email the people who care, and scheduled PDF snapshots.
- For
- Extra Tools
- Odoo versions
- 17.0, 18.0, 19.0, 20.0 - Community and Enterprise
- Runs on
- Odoo.sh or Odoo you host yourself - not Odoo Online, which accepts no third-party apps
- Price
- 129 EUR, one-time, on the Odoo Apps Store
- Technical name
- bambooforge_dashboard
- Not for
- The app reads from the Odoo models you point each item at, using the viewing user's own access rights and the active company; it does not send data outside your Odoo instance.; Multi-company is respected: boards and items are scoped to companies via record rules.; Board visibility is enforced by Allowed Groups plus record rules on both boards and items.; In scope today: tiles, the full chart set (bar, horizontal bar, line, area, pie, doughnut, polar area, radial bar, scatter, radar, flower, funnel), KPIs with target / previous-period comparison, list views with target & deviation columns, partner maps, flat and dated targets, drag-and-drop layout, date filtering, email / PDF / image export.; Limits: each chart is capped at 500 group-by buckets for performance, so a very high-cardinality group-by is truncated — group by a coarser field instead. The Map view plots partners that have geolocation coordinates. Targets render on bar/horizontal-bar/ line/area charts and KPIs only.
- Compared with the alternatives
- https://docs.bambooforge.dev/bambooforge_dashboard/compare/
- Manual last updated
- 2026-10-15
Dashboard Builder: Drag-and-drop KPI Dashboards
Build live operational dashboards inside Odoo 20 without writing code: drop in tiles, charts, KPIs and lists that read straight from any Odoo model, group and measure the data the way you want, drag the tiles into place, then set targets and share the board with the right people.
This page is the complete manual. If you follow it top to bottom you can install the app, build your first dashboard, add a chart with the chart builder, set KPIs and targets, share the board, and fix the common issues without contacting support.
Overview
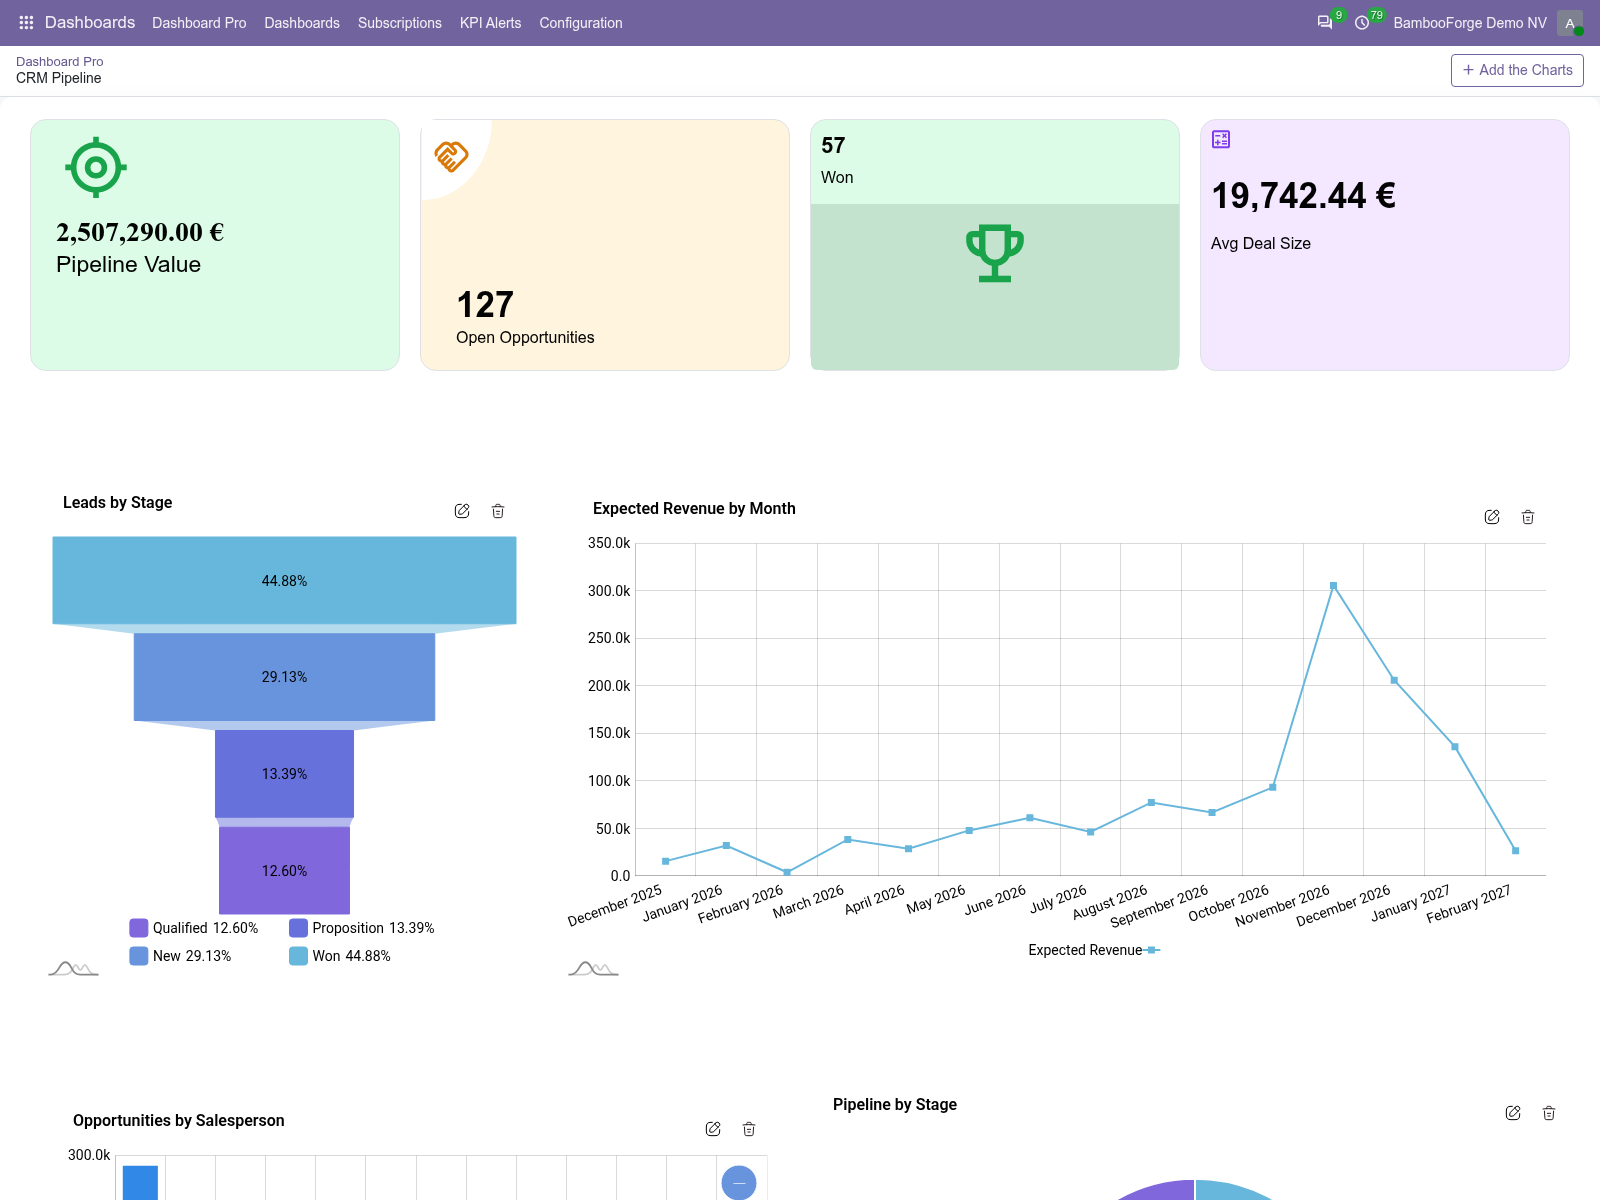
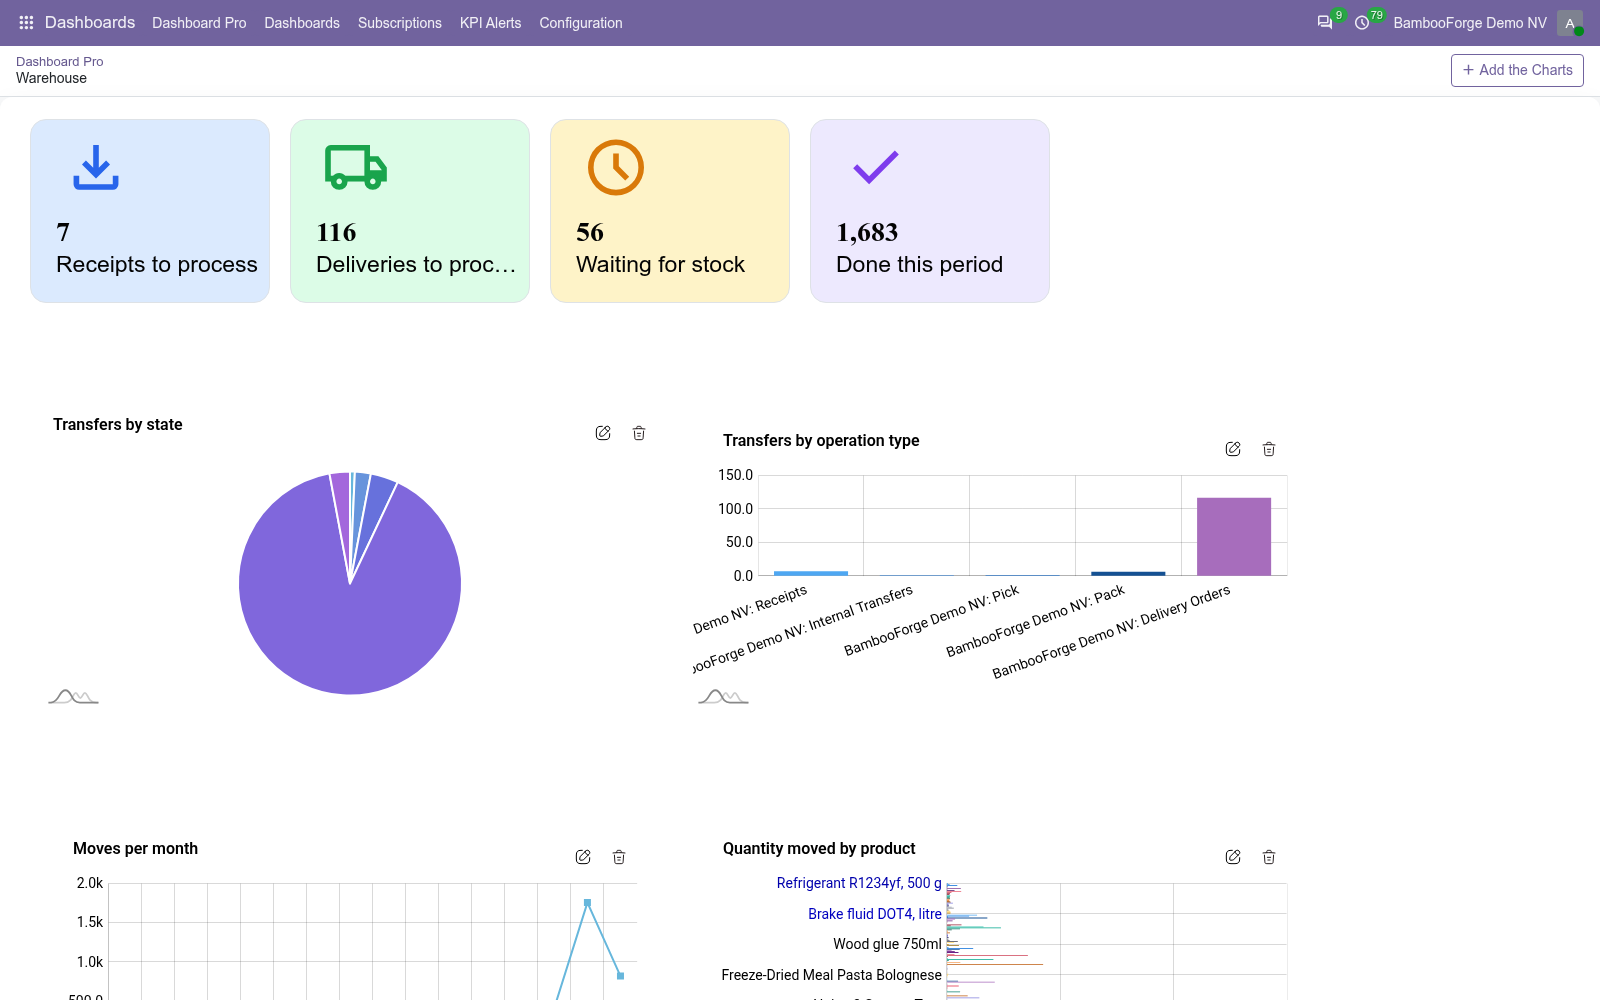
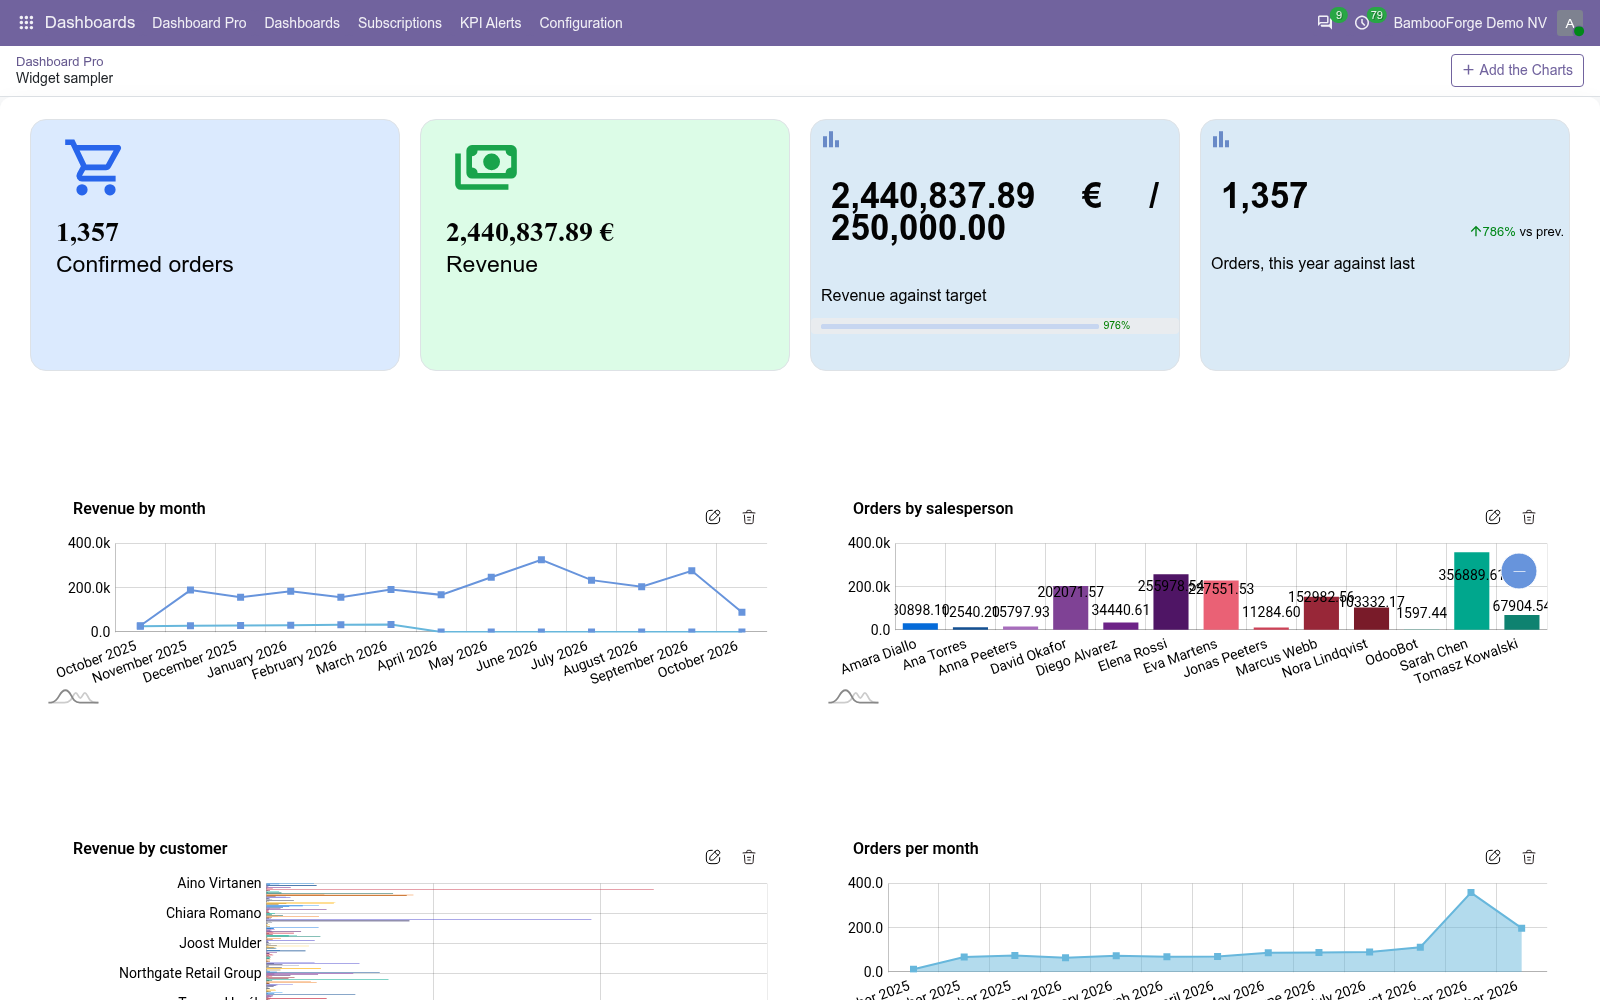
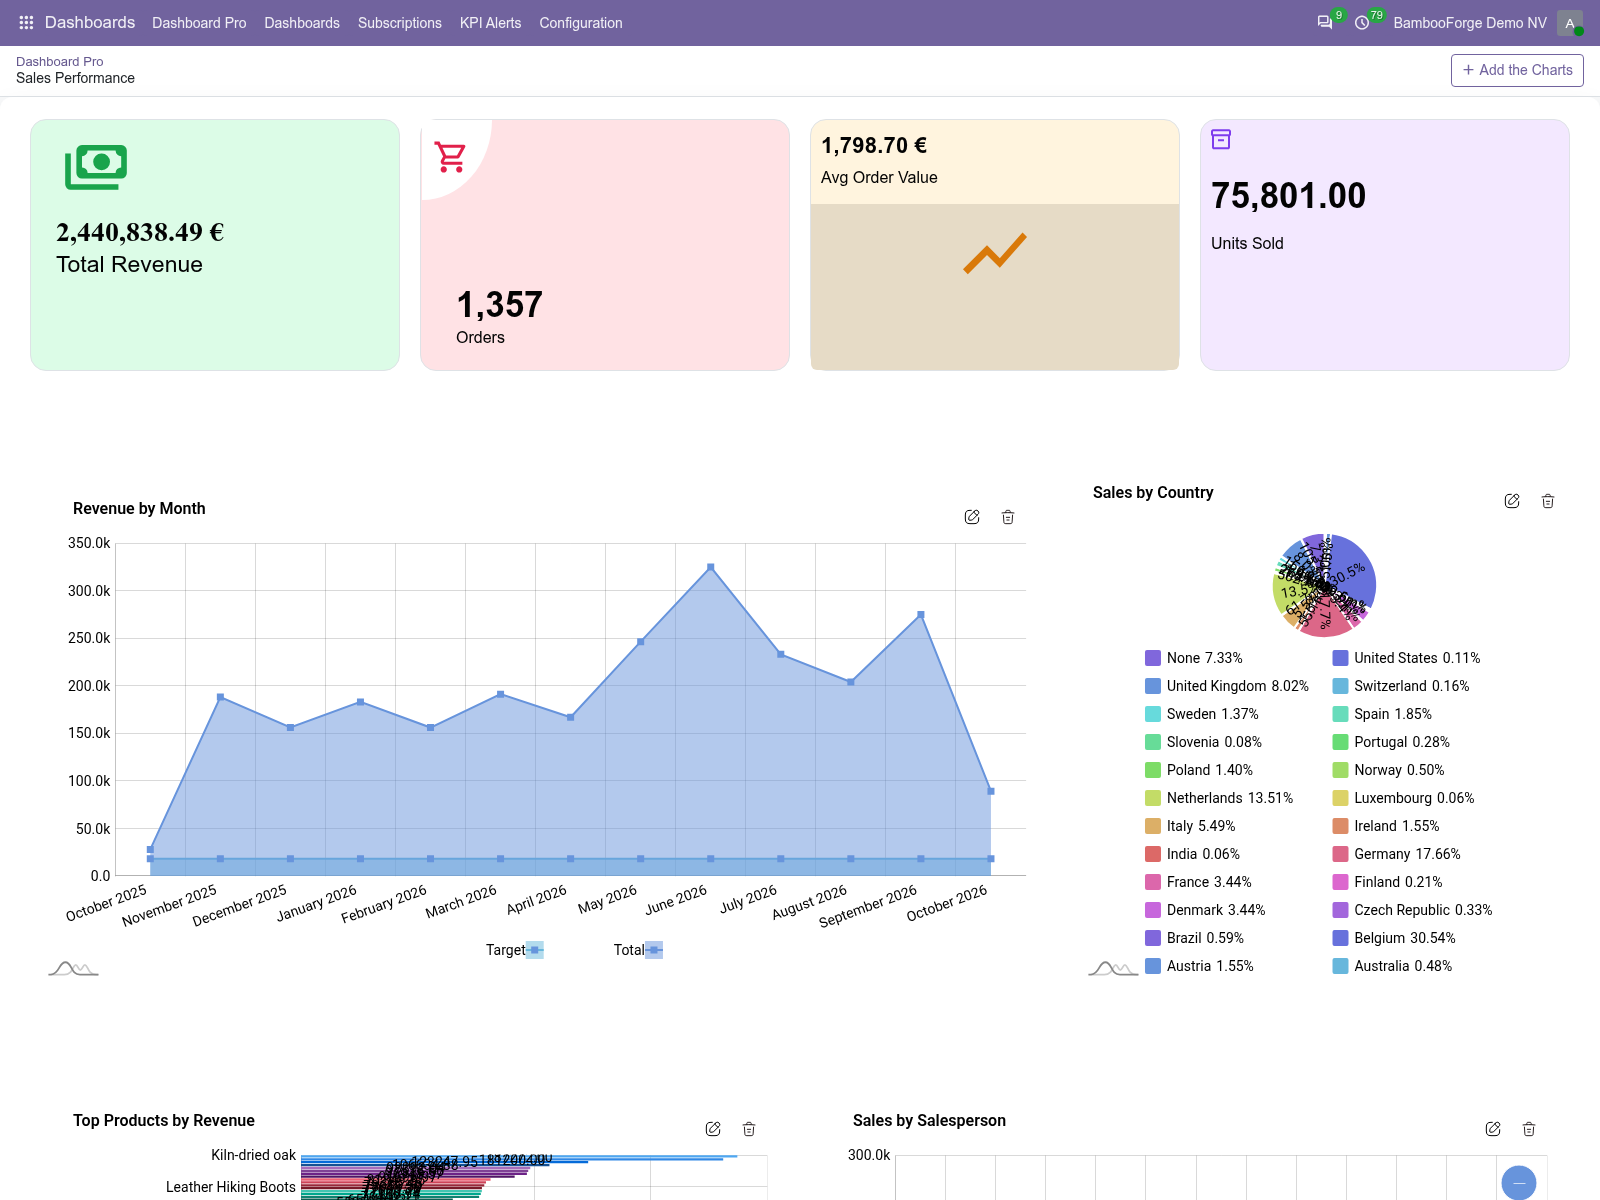
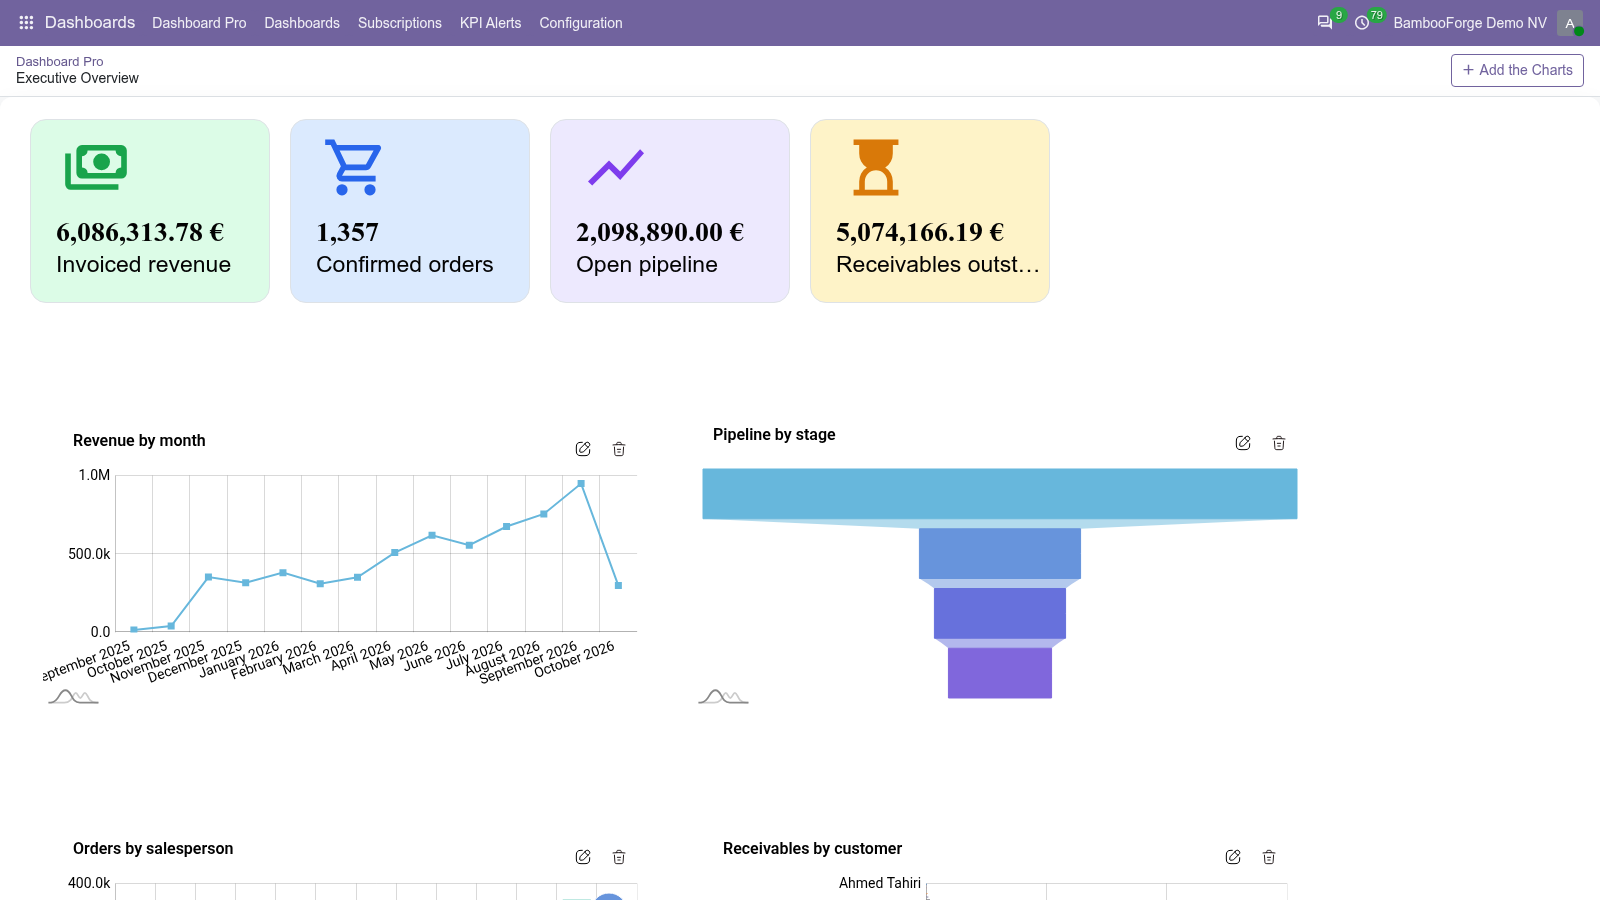
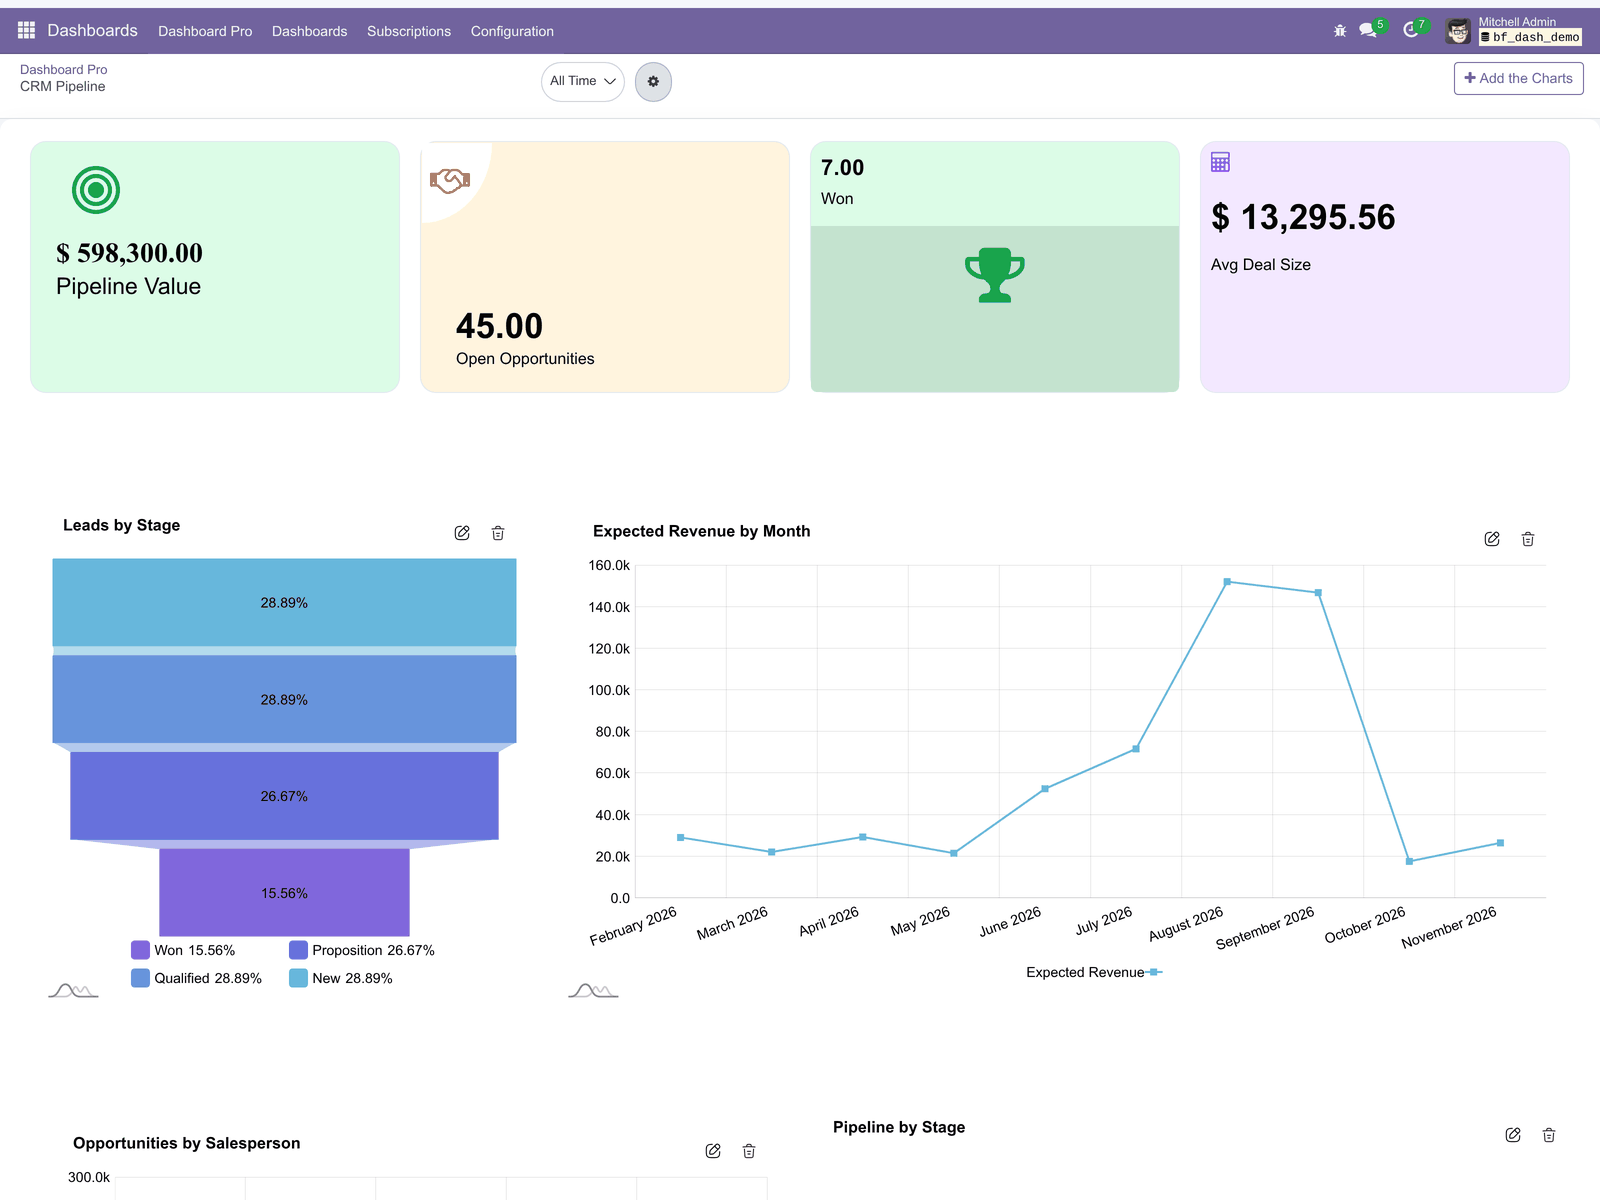
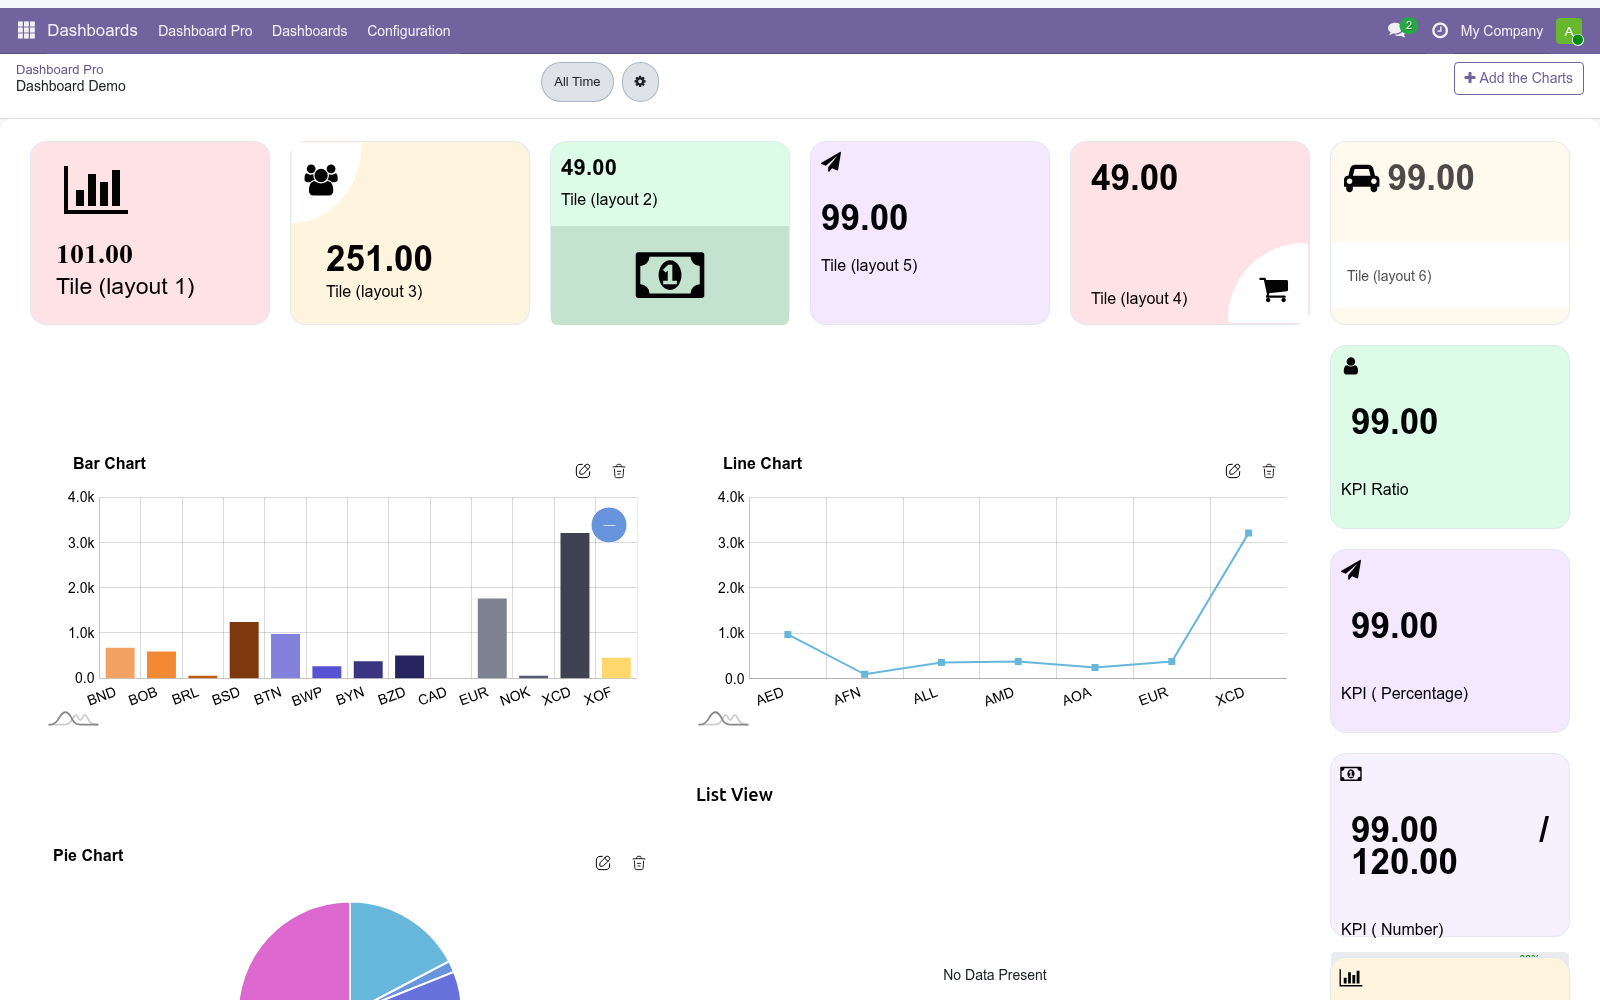
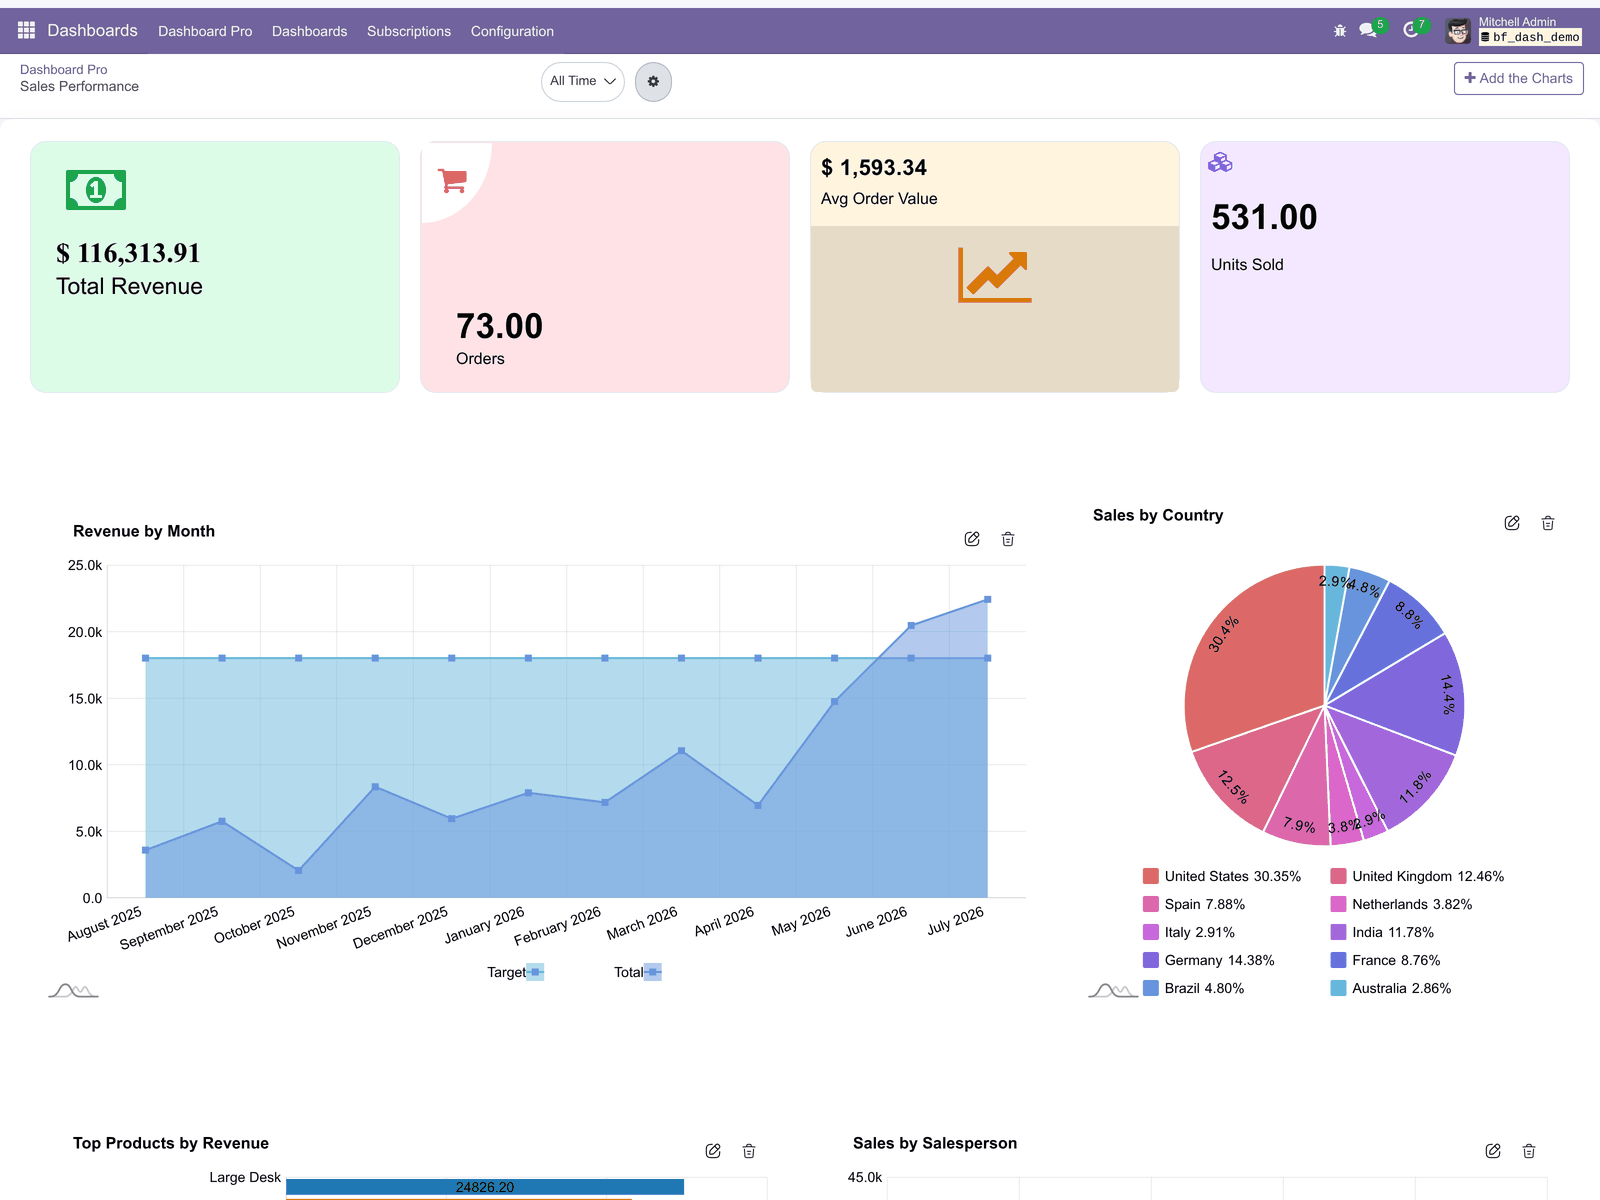
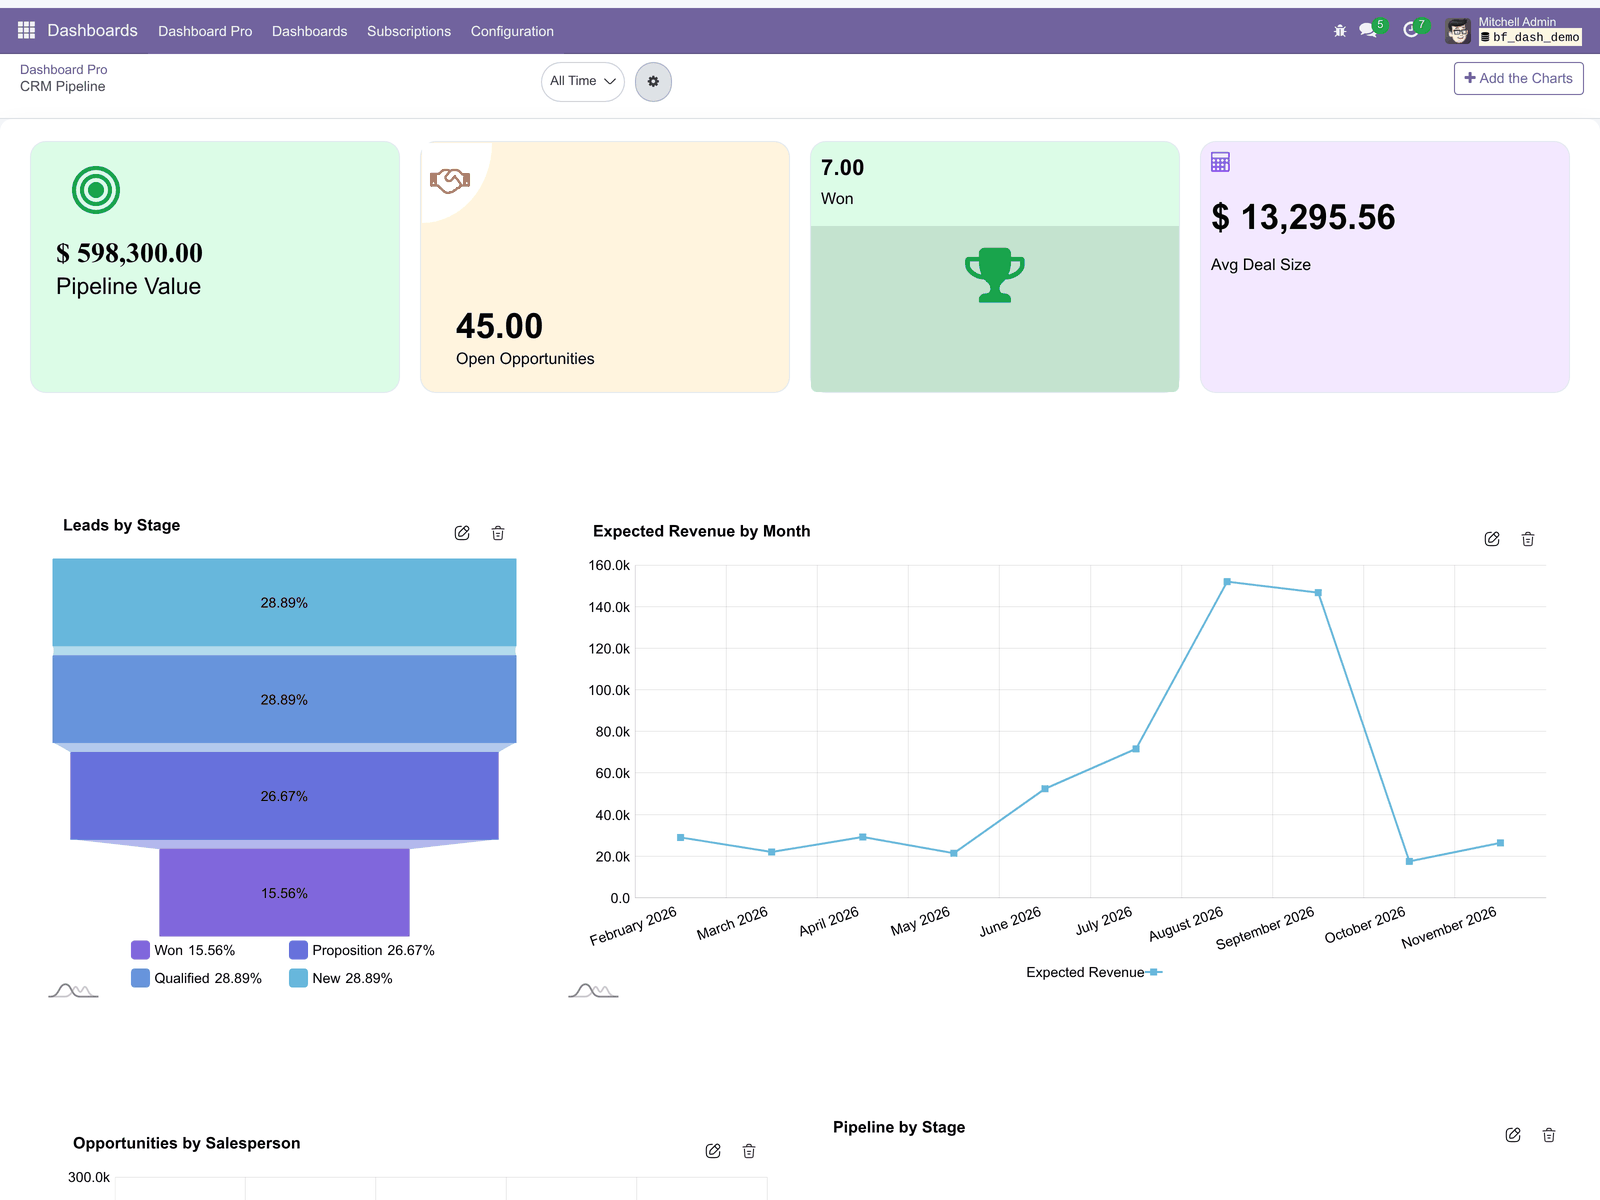
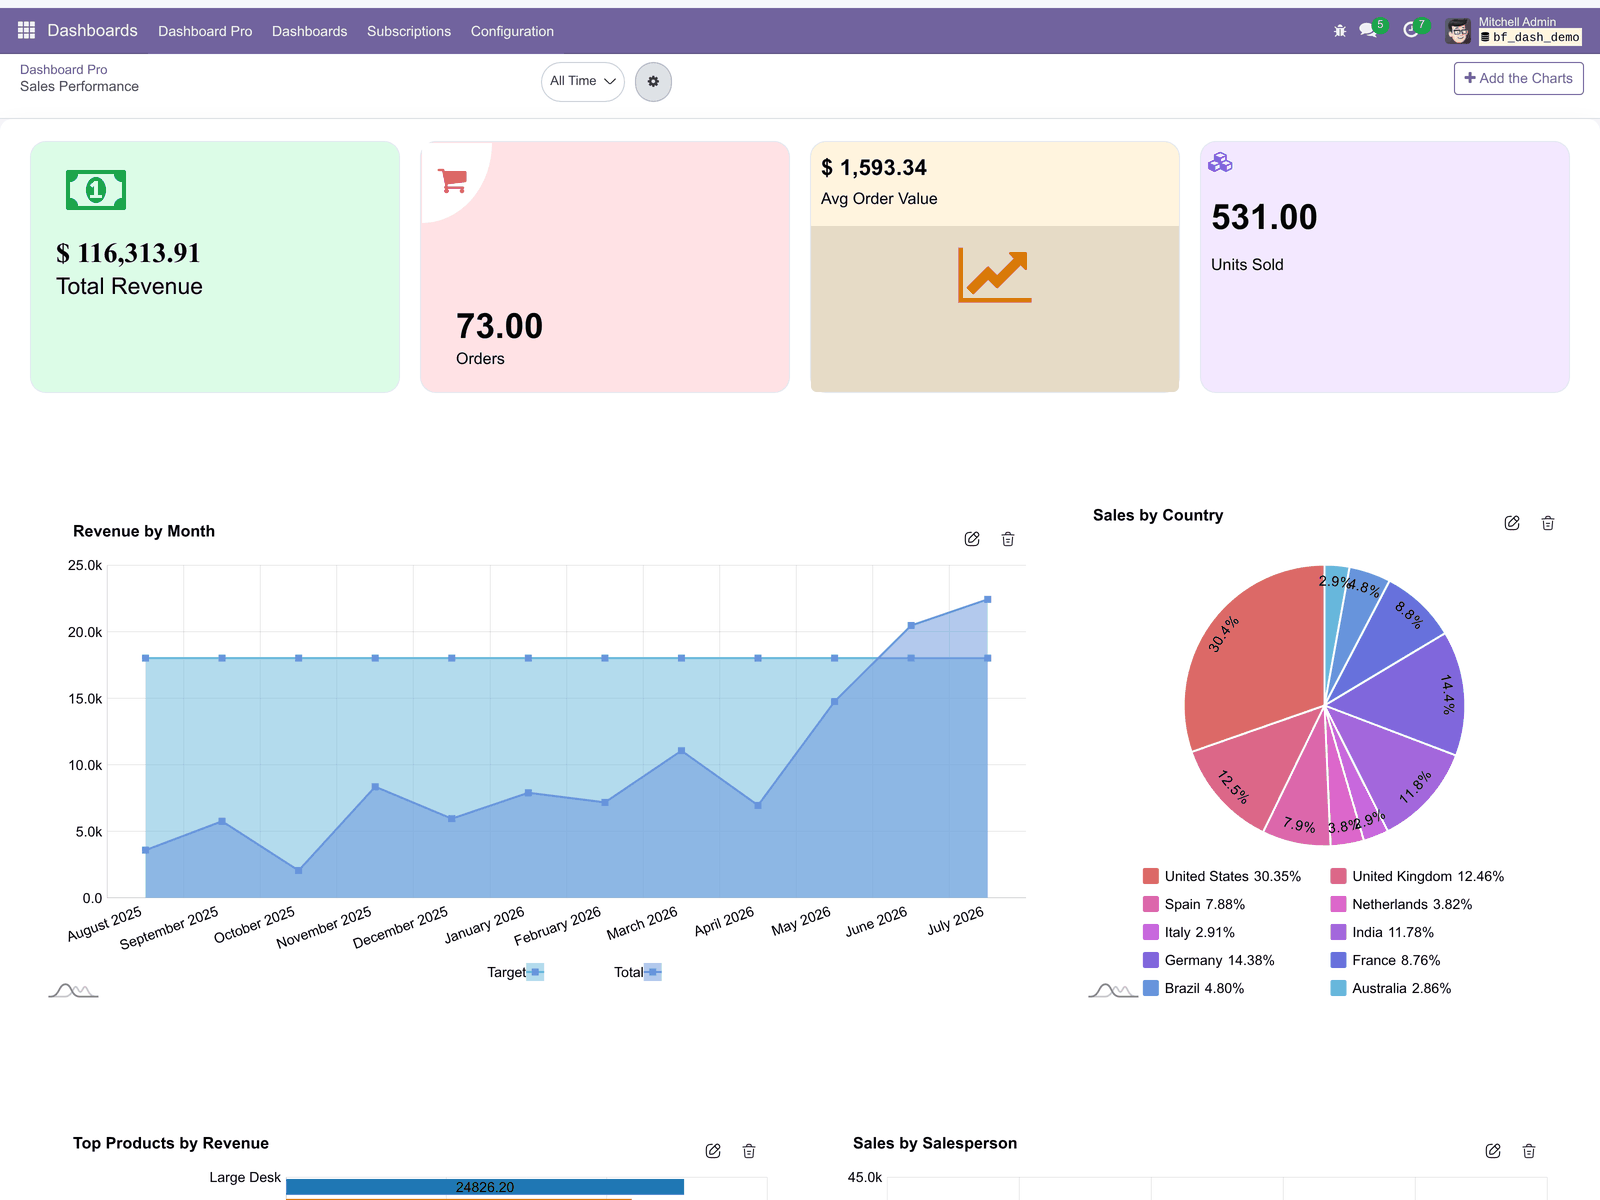
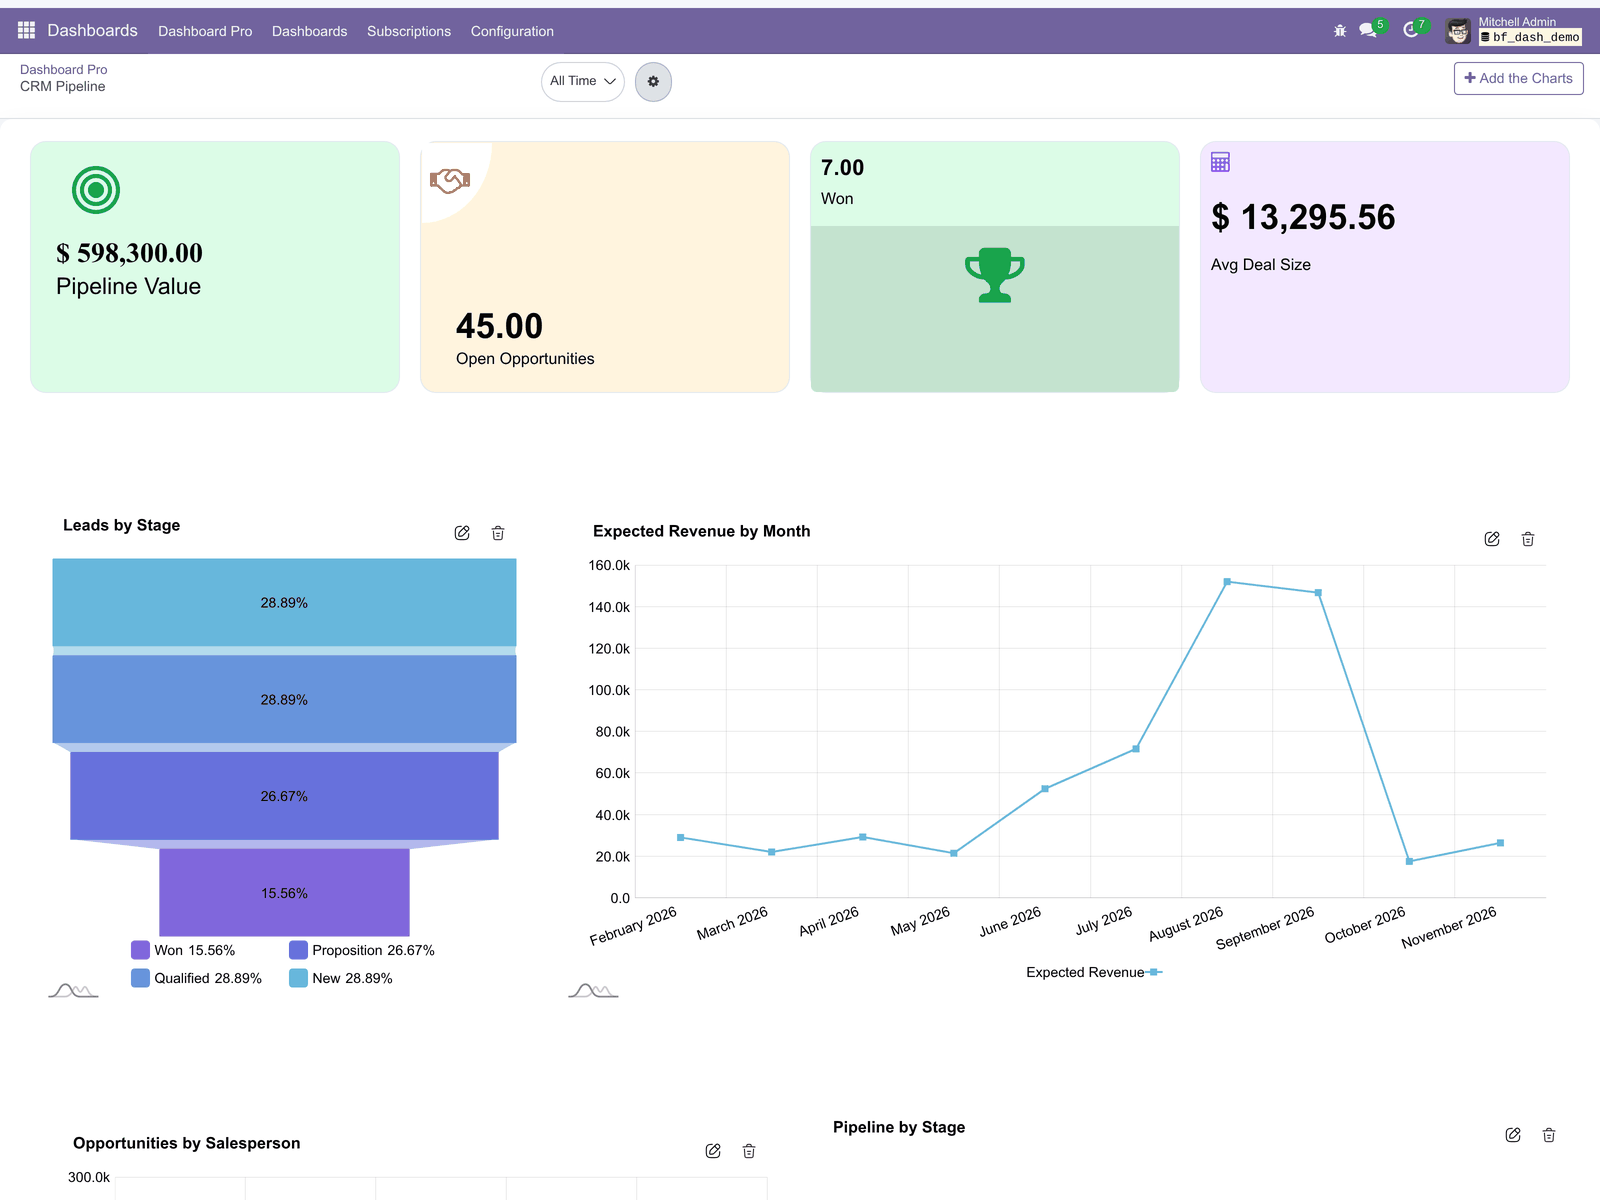
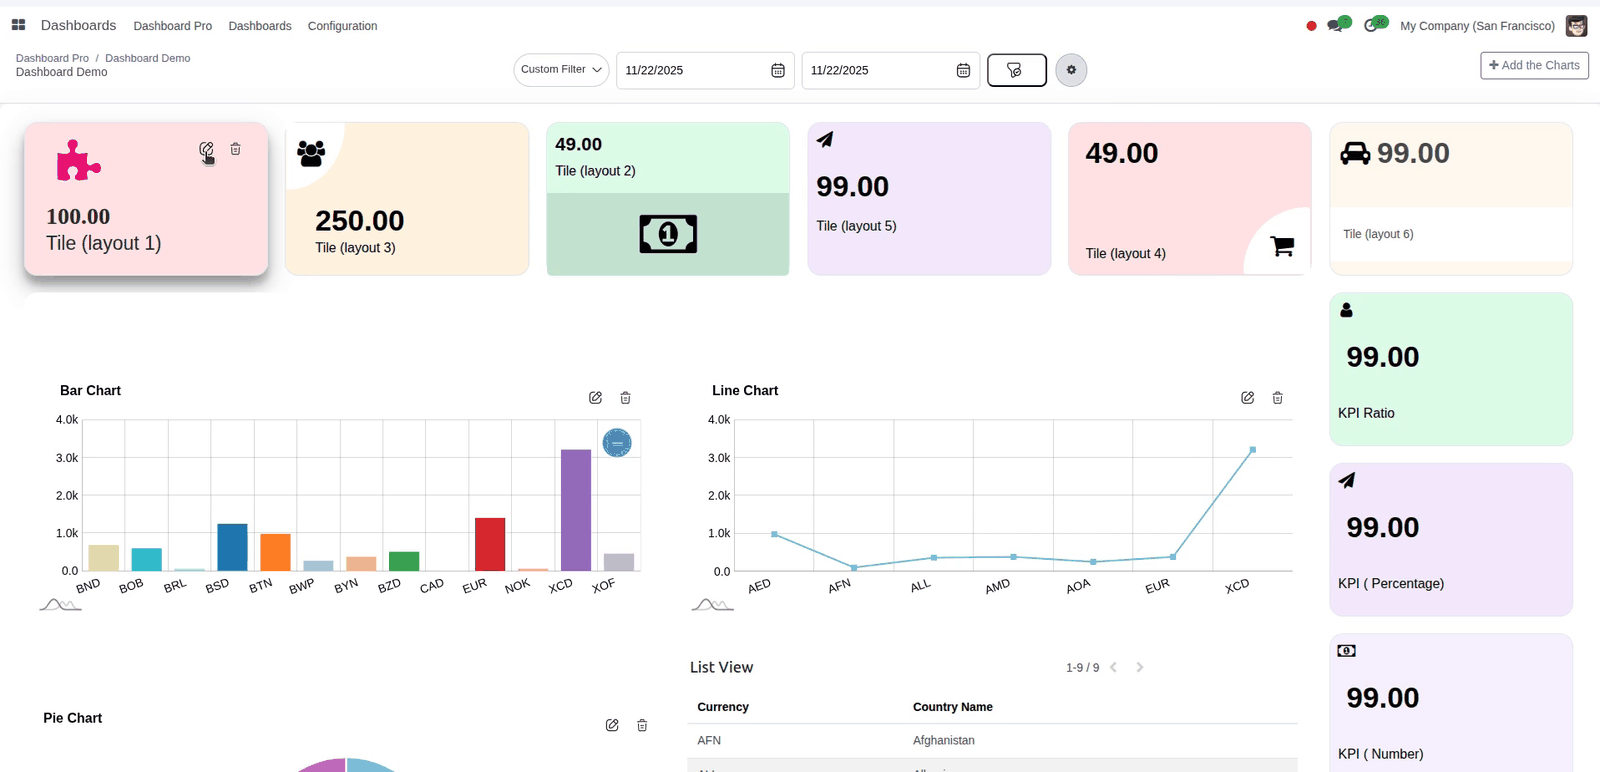
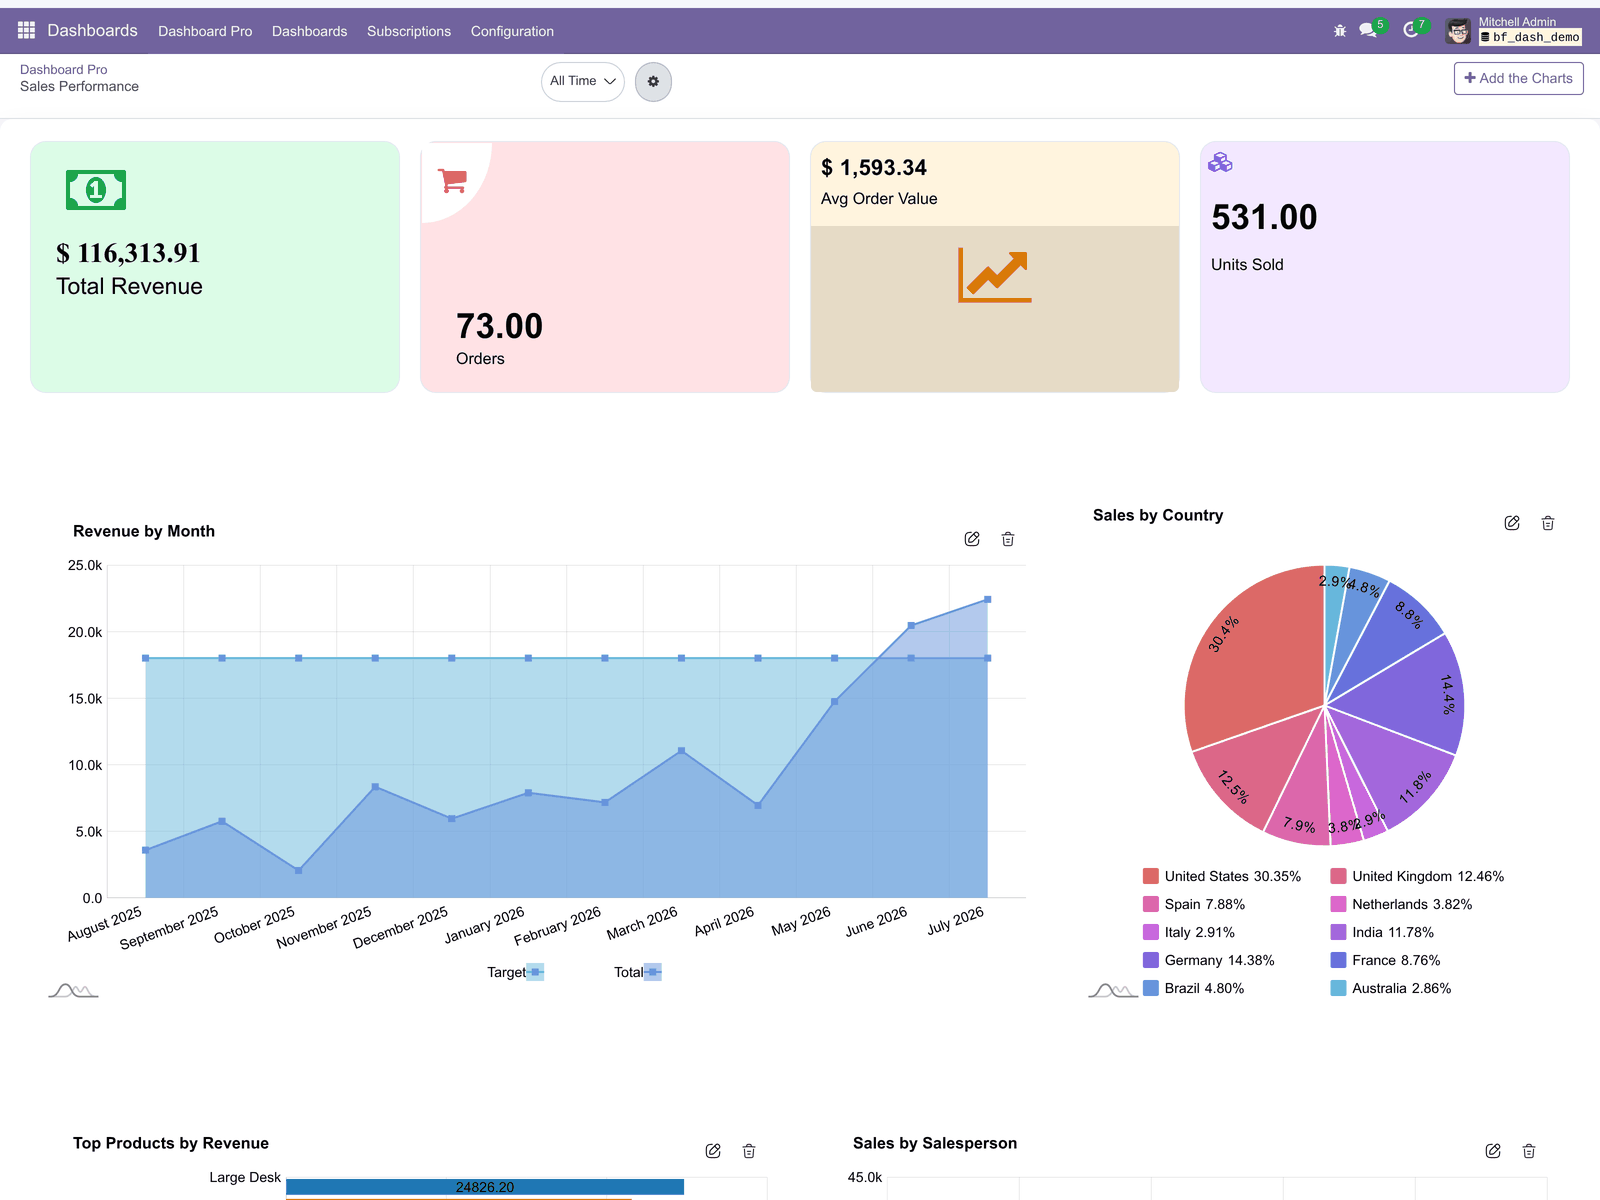
BambooForge Dashboard turns any Odoo model into a visual dashboard. Each dashboard is a board that holds items; every item reads its own model, applies its own filter, and renders as a tile, a chart, a KPI, a list or a map. You arrange the items on a drag-and-drop grid and save the layout.
It covers:
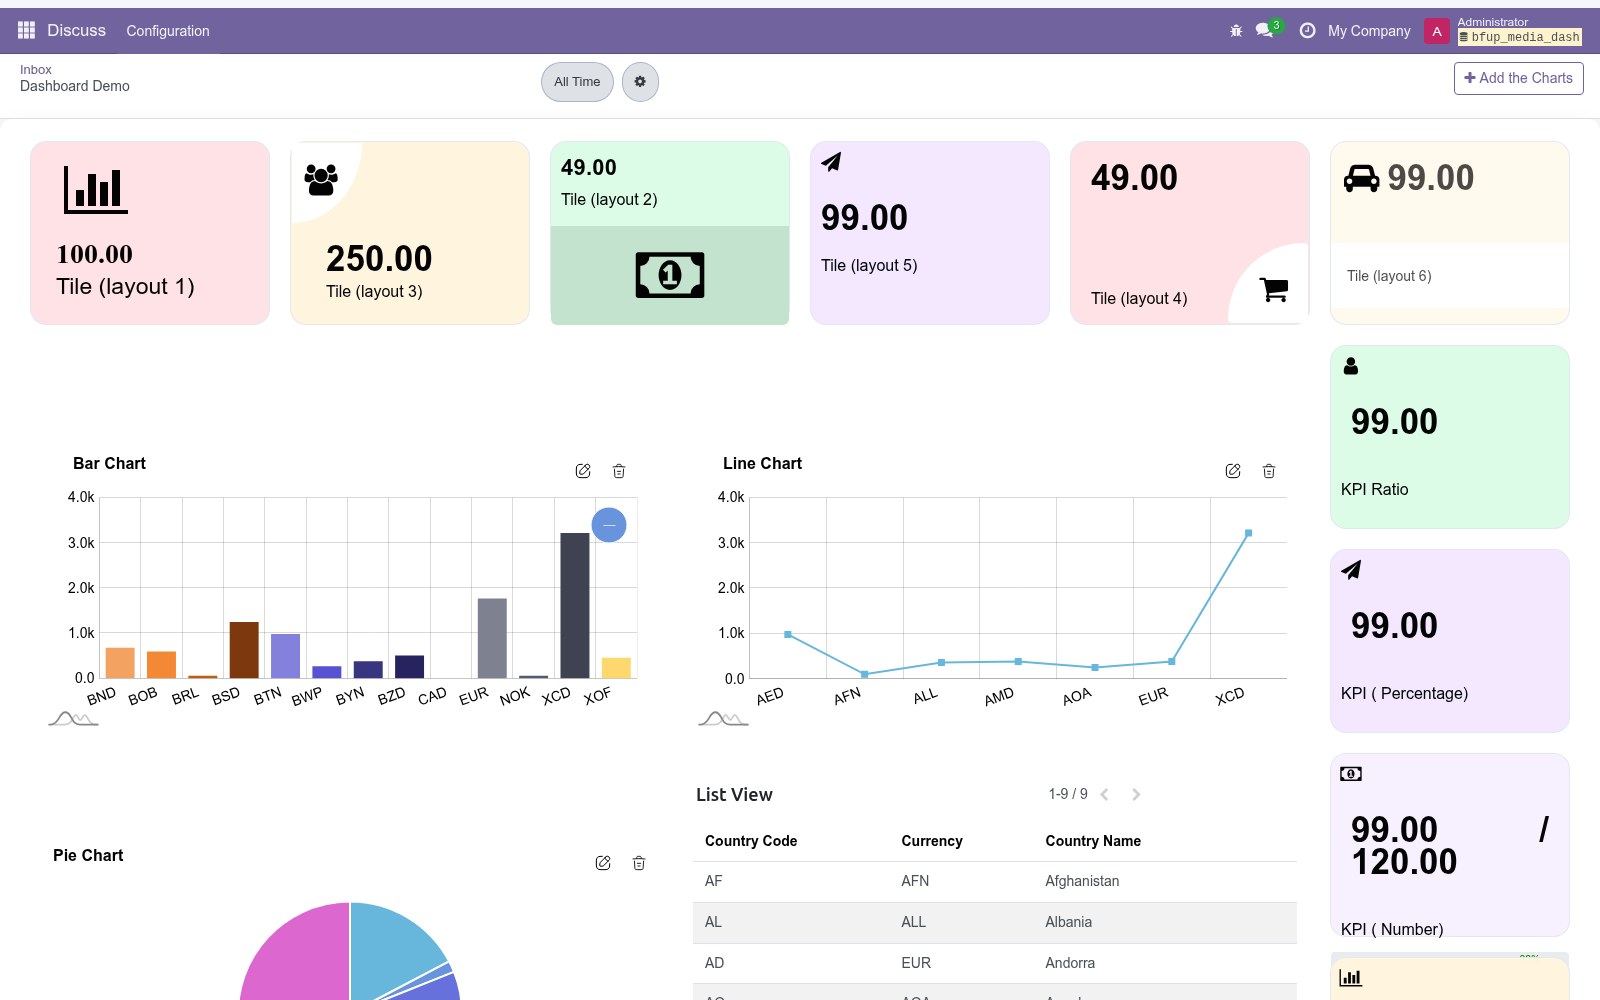
Tiles — a single number (count, sum, average, or a Python expression) with an icon, colour and optional unit.
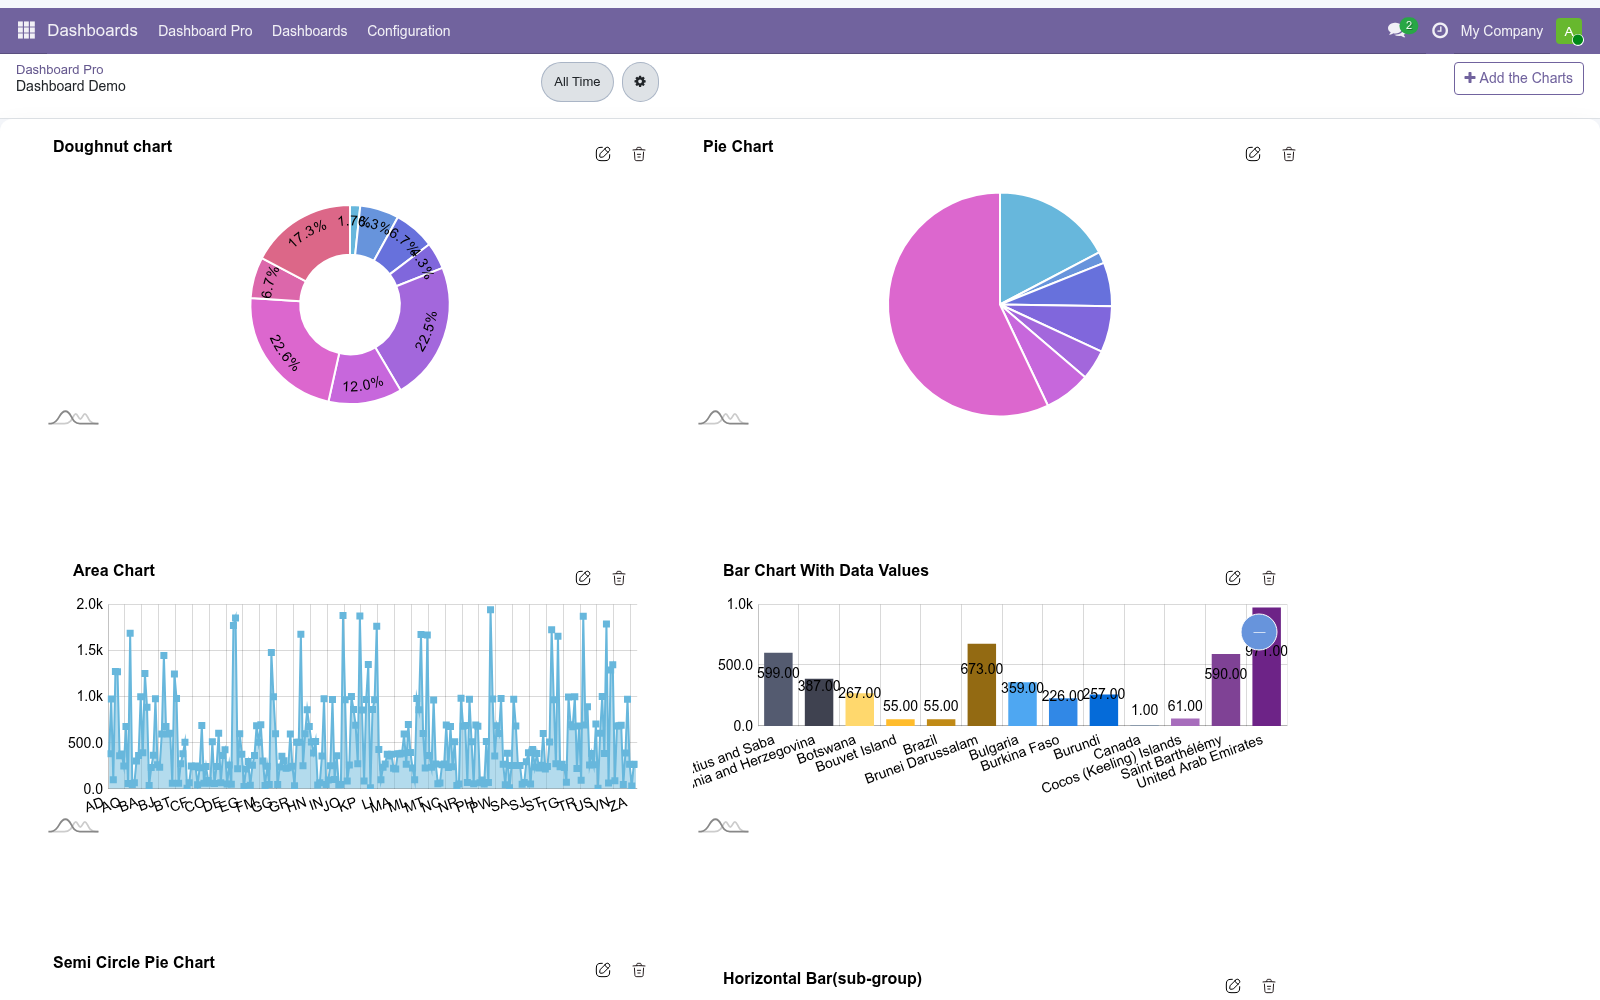
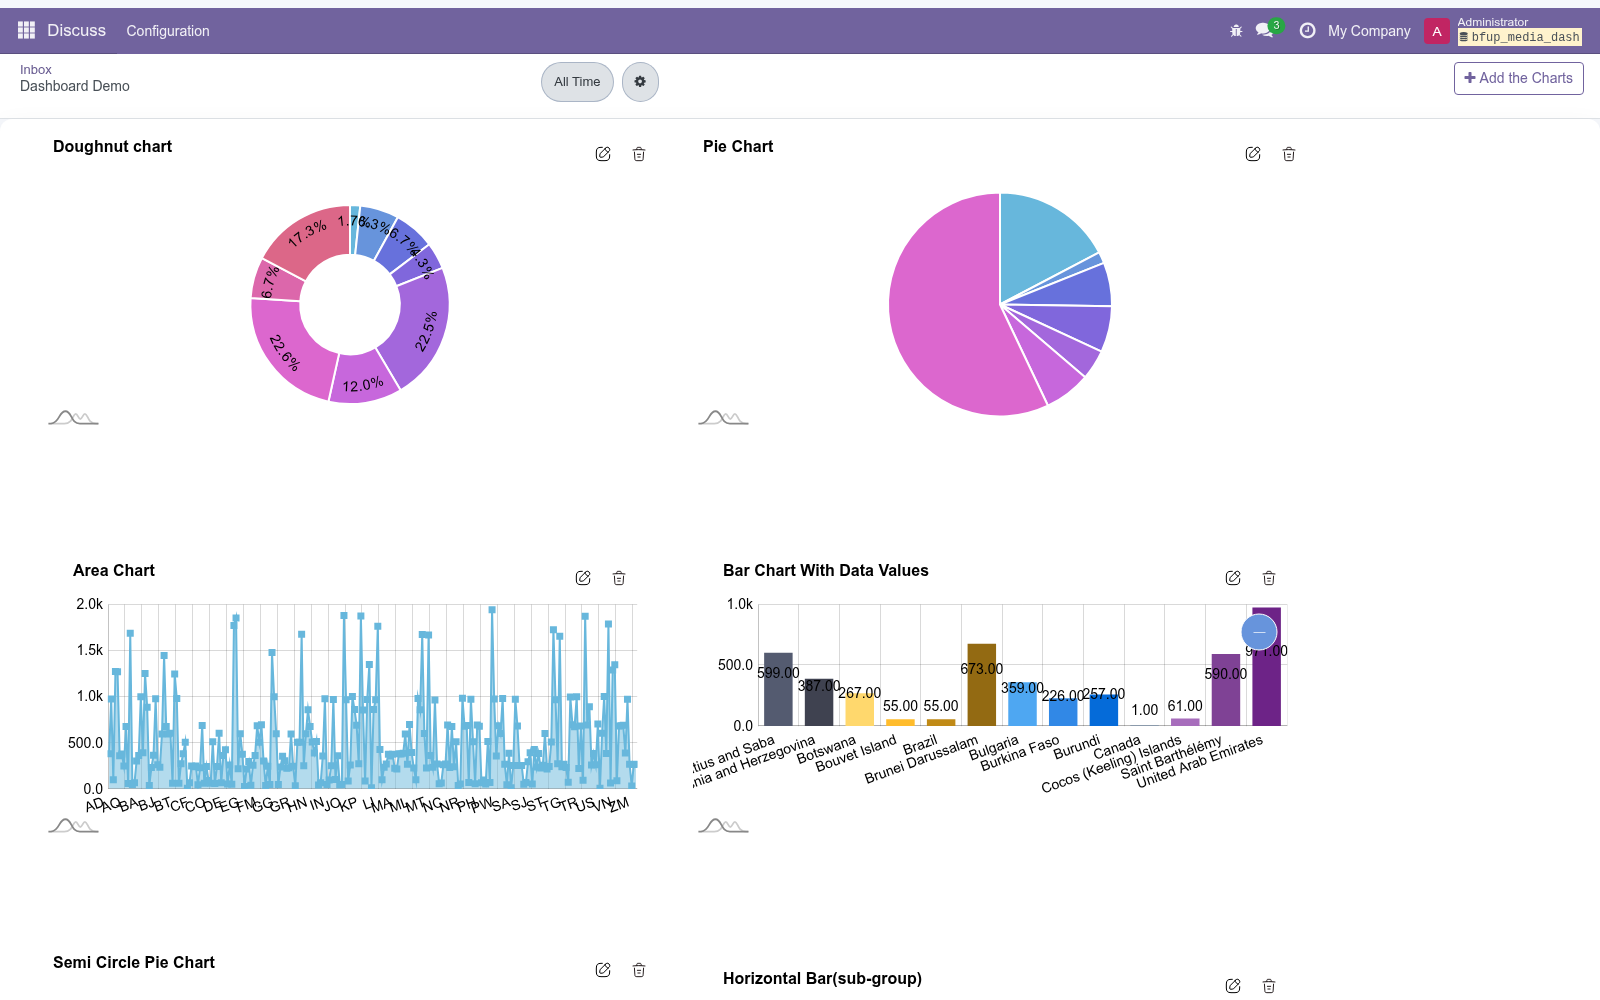
Charts — bar, horizontal bar, line, area, pie, doughnut, polar area, radial bar, scatter, radar, flower, funnel — each built from a model, a measure and a group-by.
KPIs — a single headline number with an optional target or a previous-period comparison.
Lists — a paginated table of records with the fields you choose, optional target and deviation columns.
Maps — partners plotted by geolocation.
Targets — a flat standard target, or dated target lines plotted against time-grouped charts and KPIs.
Every item reads live data through Odoo's own read_group / search engine, so it always reflects the current database and respects the user's access rights and the active company.
Requirements
Odoo: 20.0, Community or Enterprise.
Dependencies: the app depends on Spreadsheet Dashboard (spreadsheet_dashboard), Geolocalization (base_geolocalize), Sales (sale_management) and CRM (crm); all of them install automatically, so a database without Sales or CRM gets both. The Spreadsheet Dashboard menu becomes the home of the Dashboard Pro menu, Geolocalization provides partner latitude/longitude for the Map view, and Sales and CRM carry the ready-made sales and pipeline boards.
Python: no extra libraries beyond a standard Odoo 20 install. All charting libraries (amCharts 5, gridstack, pdfmake) ship inside the module.
Odoo access: every internal user (group base.group_user) can view dashboards they are allowed to see. Only a Dashboard Manager (spreadsheet_dashboard.group_dashboard_manager) can create, edit or delete boards and items. The Odoo administrator (base.group_system) is a Dashboard Manager by default.
Network: none. Everything runs inside Odoo against your own database.
Installation
Copy bambooforge_dashboard into your Odoo addons path.
Restart the Odoo service.
Open Apps, click Update Apps List, search for BambooForge Dashboard, and press Activate / Install. The Spreadsheet Dashboard and Geolocalization dependencies install automatically.
After install you will find a Dashboards application in the main menu. The app adds a Dashboard Pro entry under it (menu Dashboards ▸ Dashboard Pro). Demo data installs a ready-made Dashboard Demo board you can open to see every item type at once.
Getting started — build your first dashboard
You build a dashboard in three moves: create the board, add items (tiles, charts, KPIs, lists, maps) to it, then arrange and save the layout.
Step 1 — Create a dashboard board
Open Dashboards ▸ Dashboard Pro. You see the boards as kanban cards.
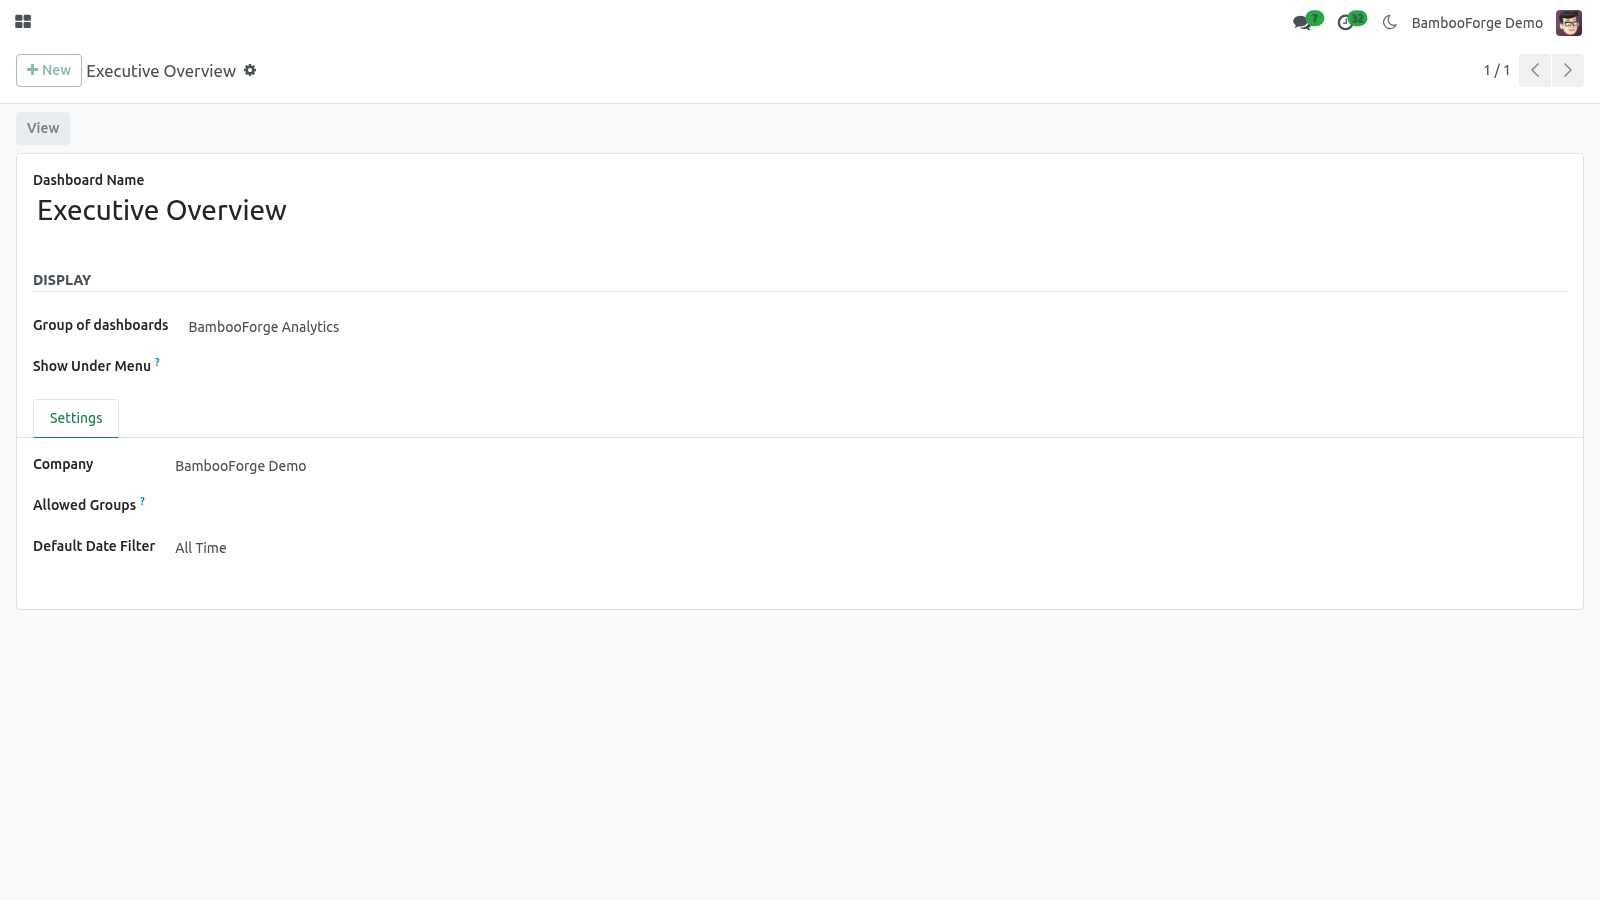
Click New and fill in the board form:
Field |
What to enter |
|---|---|
Dashboard Name |
The board title, e.g. Sales Overview. |
Group of dashboards |
Optional grouping shown in the left search panel (Sales, CRM, Finance, Logistics, Services, Marketing, Website, Human Resources ship as defaults). |
Show Under Menu |
Optional. Pick one or more existing menus; the app auto-creates a link to this dashboard directly under each chosen menu so users reach it from where they work. |
Menu Name |
The label for those link menus (defaults to the Dashboard Name if left blank). |
Company |
Multi-company only. The company that owns the board; its items inherit it. |
Allowed Groups |
The security groups allowed to open this board. Leave blank and every internal user can see it; set one or more groups to restrict it (see Usage — sharing & access). |
Default Date Filter |
The period the board opens on: All Time, Week/Month/Quarter/Year to Date, Last 7/30/90/365 days, or Custom Filter (then pick a start and end date). |
Click Save, then View (header button) to open the live dashboard.
Step 2 — Add a chart with the chart builder
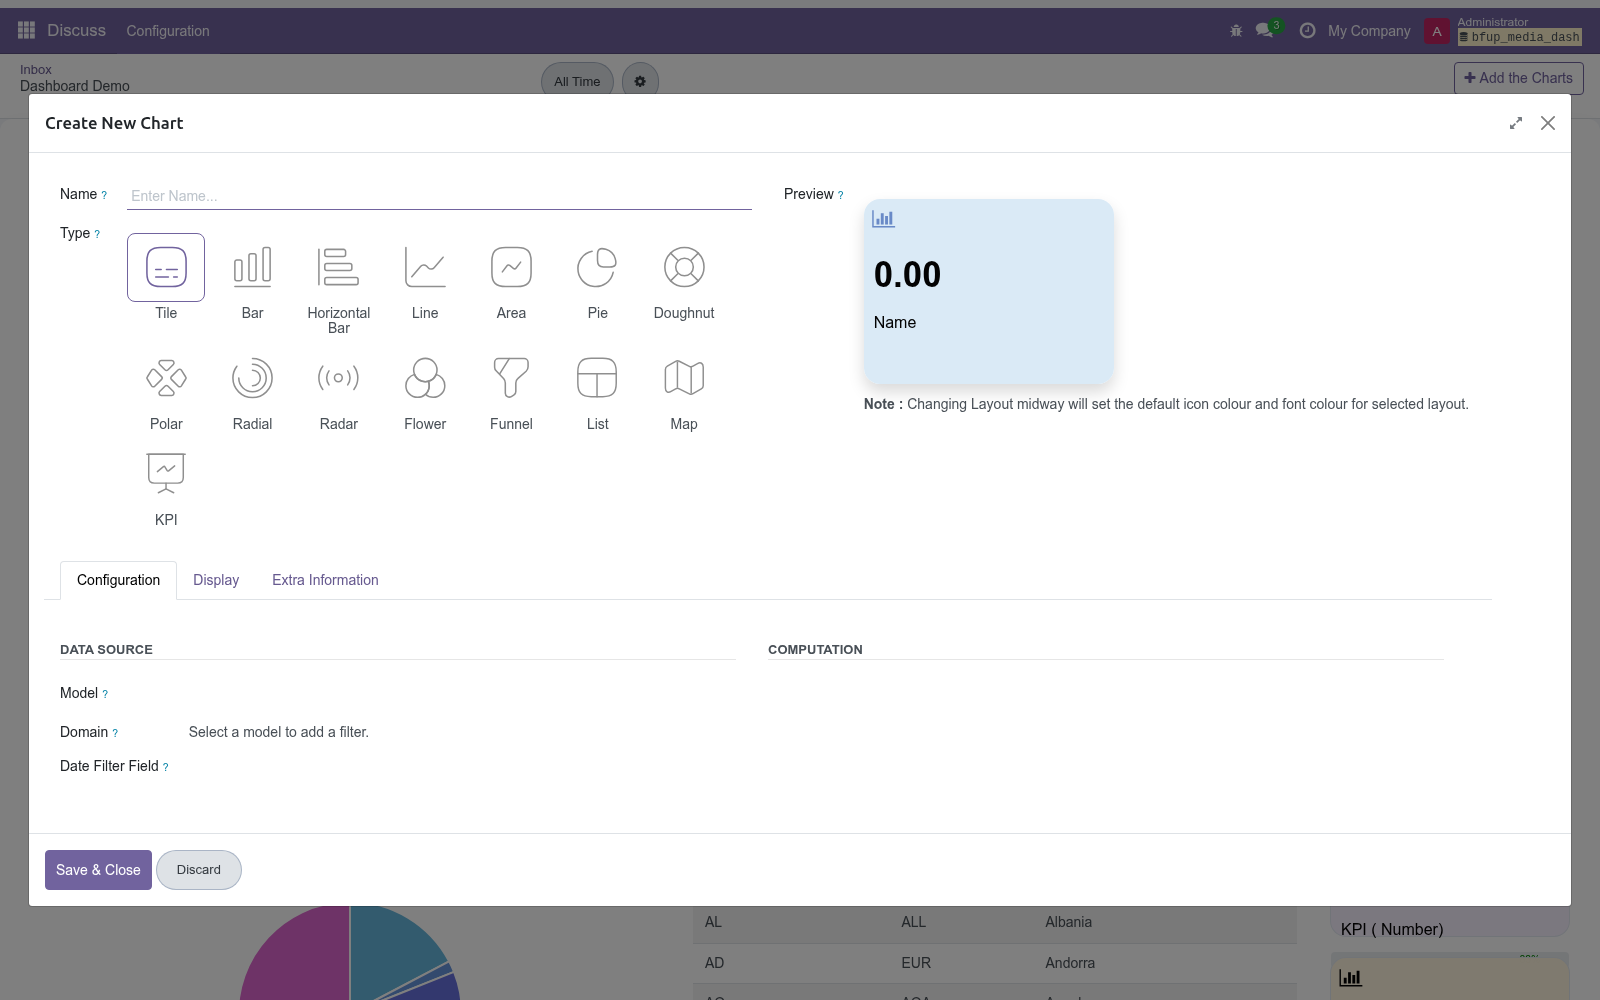
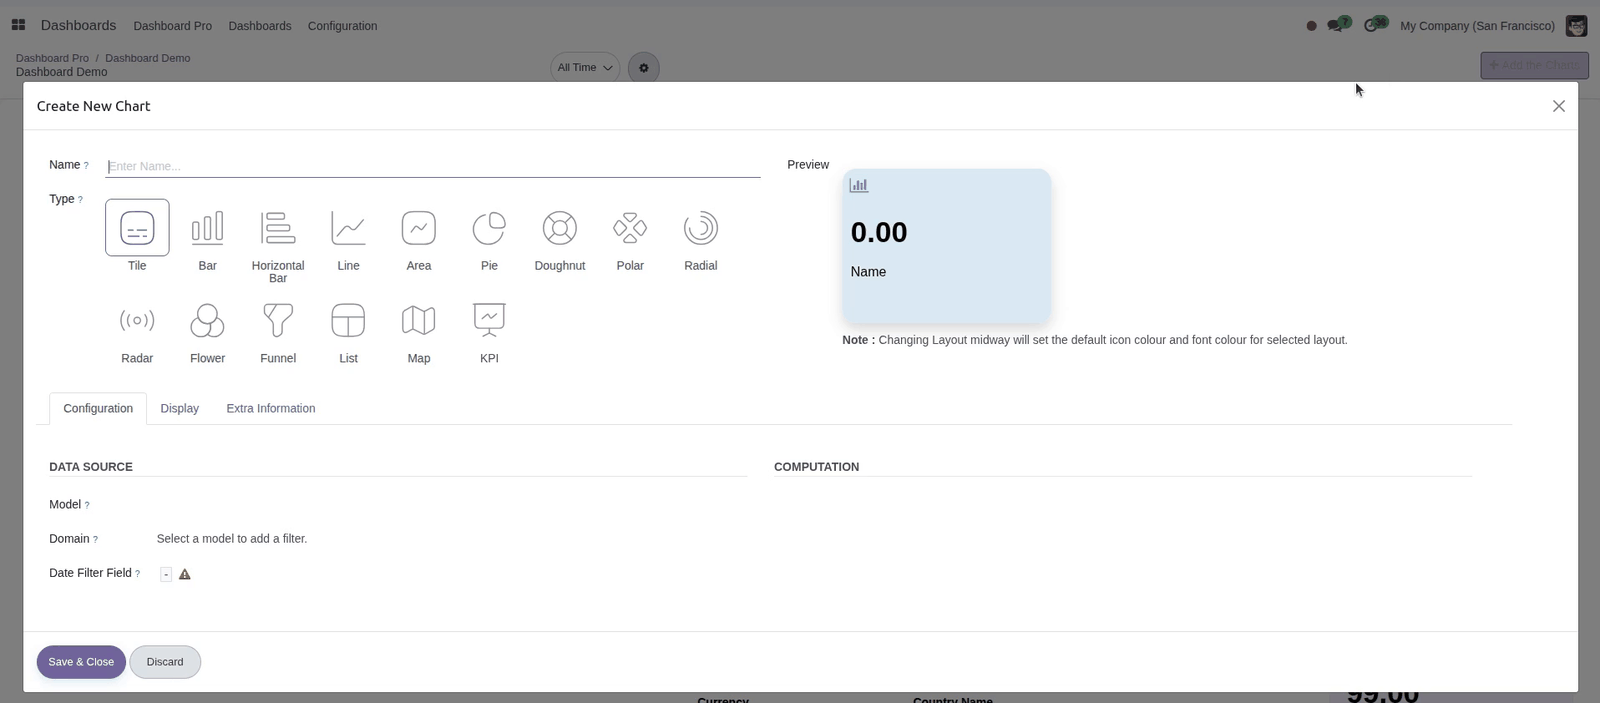
On the open dashboard, as a Dashboard Manager you get an Add the Charts button (the + in the control panel). Click it to open the item builder form.
Fill it in top to bottom:
Name — a unique label for the item.
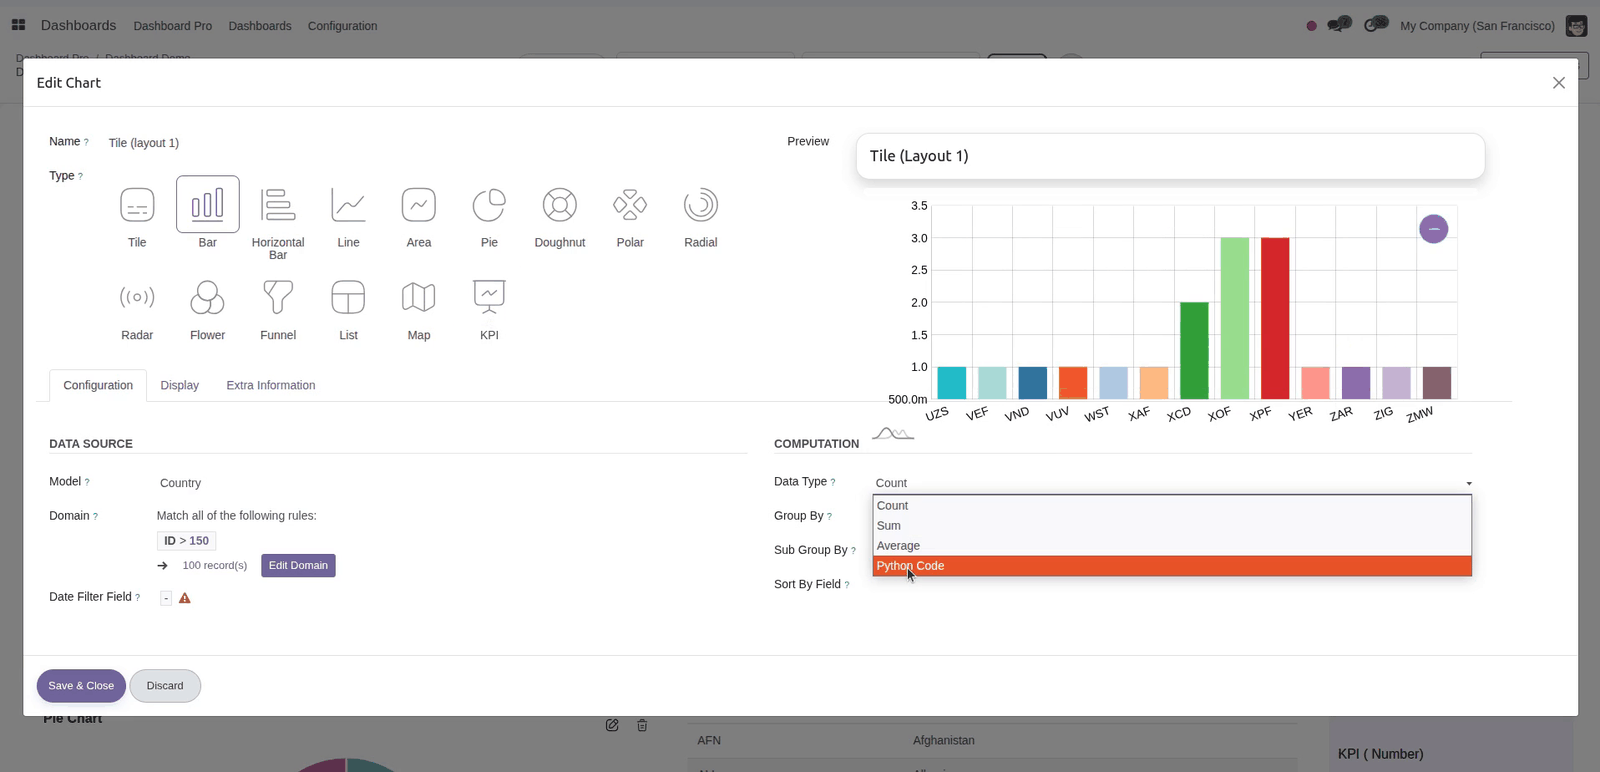
Type — pick the item type. The live preview on the right updates as you configure the rest. Available types:
Type |
What it renders |
|---|---|
Tile |
A single value with icon, colour and optional unit. |
Bar Chart / Horizontal Bar Chart |
Vertical or horizontal bars; supports stacking with a sub-group. |
Line Chart / Area Chart |
Trends over a group-by (often a date); supports a cumulative line. |
Pie / Doughnut Chart |
Share of a measure per group; doughnut/pie can render as a semi-circle. |
Polar Area / Radial Bar Chart |
Circular comparison of a measure across groups. |
Scatter Chart |
Points for value distribution. |
Radar View / Flower View |
Multi-axis comparison. |
Funnel Chart |
Stages sorted high-to-low (sort order is forced to descending). |
List View |
A paginated table of records with chosen fields. |
KPI |
A single headline number with optional target / comparison. |
Map View |
Partners plotted on a world map by geolocation. |
Model (Data Source ▸ Model) — the model the item reads, e.g. Sales Order. This is the source of every measure and group-by below. Transient models are excluded.
Domain — optional filter conditions (the standard Odoo domain editor), e.g. only confirmed orders.
Date Filter Field — the date/datetime field the board's date filter applies to (defaults to Created on when you pick a model). It must be a Date or Datetime field.
Data Type (Computation ▸ Data Type) — how the measure is aggregated:
Data Type |
Meaning |
|---|---|
Count |
Number of records matching the model + domain (no measure field needed). |
Sum |
Sum of a numeric Measure field. |
Average |
Average of a numeric Measure field. |
Python Code |
A small expression evaluated per group, with records (the matching recordset) in scope; set the answer in result. Example: result = len(records). |
Measure — for Sum / Average, the numeric field to aggregate (only integer, float or monetary fields are offered).
Group By — the field that becomes the chart's x-axis / categories (any stored field except binary and x2many). If it is a date/datetime field, also pick a Group By Type (Day, Week, Month, Quarter, Year).
Sub Group By — optional second level of grouping; produces stacked bars or multiple series. With a sub-group you can enable Stacked Bar Chart.
Sort By Field / Sort Order — optional ordering of the buckets.
Switch to the Display tab to set colours, icon, layout, Show Data Value, Show Legend, Show Records (click-through to the underlying Odoo list), and custom unit (monetary or a short text unit such as km). Save the item; it appears on the board.
Step 3 — Set KPIs and targets
KPI item. Choose Type = KPI, pick a Model, Data Type and (for sum/average) a Measure. In the Target group:
Tick Enable Target and enter a Standard Target value — the KPI shows the headline number against that target.
Or tick Compare With Previous Period (in the KPI Data Source group) to show the current value next to the same metric for the previous period (Week/Month/Quarter/Year to Date map to last week/month/quarter/year).
Chart targets. Bar, horizontal bar, line and area charts can show a target too:
A Standard Target value plots a flat target series across every bar/point. Show it as an extra bar, or as an overlaid line by enabling Show Target As Line.
Dated target lines (per-date goals) apply when the chart is grouped by a date field: each goal has a Date and a Value, and the targets are matched to the matching time buckets of the chart. When dated target lines are in use, the list/pagination limit is managed automatically.
Usage
Arrange & drag tiles
Open a board and, as a Dashboard Manager, choose Edit Layout from the gear (cog) menu. The grid becomes draggable (it uses a gridstack grid):
Drag any tile to move it; drag its corner to resize it.
Click Save Layout to persist the arrangement, or Discard to revert.
The saved arrangement is stored on the board (the Item Configurations field), so every viewer sees the same layout.
Quick-customise, move, duplicate, delete items
Hover an item to reveal its toolbar (manager only): the pencil opens a quick-customise popup for that item's type and look, the i shows its description, and the bin removes it. You can also Move an item to another board or Duplicate it across boards from the item actions.
Date filter, refresh & export
The control panel carries the board's date filter; changing it re-reads every item for the new period. From the gear menu a manager can Send by Email (uses the bundled Dashboard Report mail template), Print PDF, or Capture Dashboard (saves a board image used on the kanban card).
Customization
Look — per item: background and font colour (with transparency), a built-in icon or an uploaded image, six tile layouts, decimal places for a sum or an average (a count is always a whole number), and a custom unit (monetary symbol or a short text unit, max 5 characters).
Computation — beyond count/sum/average, the Python Code data type lets you compute a value per group from the matching records recordset (e.g. ratios across related models). The expression runs in Odoo's safe-eval sandbox.
Click-through — enable Show Records so clicking an item opens the underlying Odoo records, or attach an Item Action (an existing window action on the same model) to jump to a specific view.
Grouping — single or two-level grouping; date group-bys at Day/Week/Month/Quarter/Year; cumulative line on date-grouped charts; fill-temporal to show empty periods.
Troubleshooting
Symptom |
Cause and fix |
|---|---|
Chart / KPI shows no data |
The model has no records matching the Domain and the active Date Filter. Widen or clear the domain, switch the board date filter to All Time, and confirm the Date Filter Field points at a field that actually holds dates for these records. |
Wrong measure or aggregation |
Data Type and Measure disagree. Count ignores the measure; Sum/Average require a numeric Measure field (only integer/float/monetary fields are offered). Re-pick the measure after changing the model — changing the model clears it. |
Chart is empty but the model has data |
A required Group By is missing, or a date group-by has no Group By Type. Pick a Group By, and for date fields also pick Day/Week/Month/Quarter/Year. |
Target line not showing |
Targets only render on bar, horizontal bar, line and area charts and on KPI items. Enable Enable Target and set a Standard Target; dated target lines need the chart grouped by a date field so goals can match the buckets. |
"Pagination limit value cannot be Negative or Zero" |
The list-view pagination limit must be positive. Set a value above 0, or use dated target lines (which manage the limit automatically). |
User cannot see a dashboard |
The board has Allowed Groups set and the user is not in them, or the user is not an internal user. Add the user's group to Allowed Groups, or clear it to show the board to everyone. |
User cannot create or edit dashboards |
Only Dashboard Managers can build. Give the user the Dashboard Manager group (under the Spreadsheet Dashboard app). Plain users are view-only by design. |
Slow dashboard on a large model |
Each chart reads via read_group and is capped at 500 buckets. A high-cardinality Group By (free-text names, per-day over years) is slow and unreadable. Group by a coarser field or a larger date interval (Month/Quarter/Year) and tighten the domain. |
Map view is empty |
Partners have no latitude/longitude. Run Odoo's geolocalization on the contacts (the Geolocalization dependency) so they get coordinates to plot. |
"Start date must be less than end date" |
The board's custom date filter has the dates reversed. Set Start Date before End Date. |
Frequently asked questions
Which Odoo versions are supported? Odoo 20.0, Community or Enterprise. The app depends on the standard Spreadsheet Dashboard and Geolocalization modules, which ship with Odoo.
Do I need to write code? No. Tiles, charts, KPIs, lists and maps are built entirely from the form by picking a model, a measure and a group-by. The optional Python Code data type is there only if you want a computed value; everything else is point-and-click.
Which models can I chart? Any non-transient Odoo model your user may read. Measures are numeric fields (integer/float/monetary); group-bys are any stored field except binary and x2many.
Can different teams see different dashboards? Yes. Set Allowed Groups on each board. Leave it blank for everyone, or pick groups to restrict a board to those users — the restriction is enforced down to the item data.
Who is allowed to edit dashboards? Only users in the Dashboard Manager group (the Odoo administrator is one by default). All other internal users are view-only.
How do I move or reuse an item? Use the item's Move action to send it to another board, or Duplicate to copy it onto one or more boards.
Can I email or print a dashboard? Yes — a manager can Send by Email (using the bundled report template), Print PDF, or Capture Dashboard as an image from the gear menu.
What support and refund policy do I get? Every request is answered within 24 hours, setup help included. If you report a bug within 2 months of purchase and it is not resolved within 15 days, you are entitled to a full money-back refund.
Data, privacy & limits
The app reads from the Odoo models you point each item at, using the viewing user's own access rights and the active company; it does not send data outside your Odoo instance.
Multi-company is respected: boards and items are scoped to companies via record rules.
Board visibility is enforced by Allowed Groups plus record rules on both boards and items.
In scope today: tiles, the full chart set (bar, horizontal bar, line, area, pie, doughnut, polar area, radial bar, scatter, radar, flower, funnel), KPIs with target / previous-period comparison, list views with target & deviation columns, partner maps, flat and dated targets, drag-and-drop layout, date filtering, email / PDF / image export.
Limits: each chart is capped at 500 group-by buckets for performance, so a very high-cardinality group-by is truncated — group by a coarser field instead. The Map view plots partners that have geolocation coordinates. Targets render on bar/horizontal-bar/ line/area charts and KPIs only.
Support & updates
Support: support@bambooforge.dev — answered within 24 hours, setup help included.
Refund: report a bug within 2 months of purchase; if unresolved within 15 days, full refund.
Full source is included. Updates track the supported Odoo 20 line.
Upgrading & version compatibility
This build targets Odoo 20.0. Each Odoo major series (17.0, 18.0, 19.0, 20.0) has its own dedicated build of this module — always install the build that matches your Odoo version. Mixing a build with a different Odoo series is not supported.
Patch upgrades (same series, e.g. 20.0.1.0.0 → later)
Back up your database and filestore first.
Replace the module folder with the newer build.
Restart Odoo with the module updated:
./odoo-bin -c your.conf -u bambooforge_dashboard -d your_db
Odoo applies any schema/data changes automatically. Your existing records and configuration are preserved.
Cross-version migration (moving to a newer Odoo)
Upgrading Odoo itself is a database migration handled by Odoo's standard upgrade tooling. When you migrate the database to the next Odoo series, install the matching build of this module for that series. Data created by this module carries over with the database migration.
After any upgrade the module's scheduled actions resume on their normal cadence — no manual re-activation is required.
Uninstallation
You can remove this module at any time from Apps → (this module) → Uninstall, or from the command line. Uninstalling is clean and reversible by reinstalling — but note what is and is not deleted.
What is removed
The module's own tables and every record in them (7 models, prefixed bambooforge.*) — this is the data this module created.
The menus, actions, views and reports this module installed.
Its scheduled actions (cron jobs) — they stop immediately on uninstall.
The security groups this module defined (user assignments to them are dropped).
What is preserved
Your standard Odoo data (partners, products, sales, invoices, inventory moves) is not deleted — this module only reads and annotates it; the underlying records stay.
Attachments and chatter messages on standard records are kept.
As always, take a database backup before uninstalling in production.
Changelog
20.0.1.2.5
A count is shown as a whole number - "57 won", not "57.00 won" - on the board, in its previews and in the emailed snapshots.
The decimal places of a tile or KPI that shows a sum or an average are set on its Display tab; the field was on no screen before.
20.0.1.2.1
Built for Odoo 20: record rules and access rights rewritten onto Odoo 20's single ir.access model, the screens rebuilt on Owl 3, and every icon moved to the icon set Odoo 20 ships.
20.0.1.0.6
Current release for Odoo 20.0. This build includes:
Scheduled dashboard subscriptions: emailed PDF + inline HTML snapshots, daily/weekly/monthly, idempotent per period. Drag-and-drop, no-code Odoo dashboards with 15+ chart types, KPI targets, period comparison, drill-down and PDF export.
Feature additions and fixes ship as new builds on the Odoo Apps store; this page and the module's version reflect the current published release. Always keep the build matched to your Odoo series (see Upgrading & version compatibility).
KPI alerts
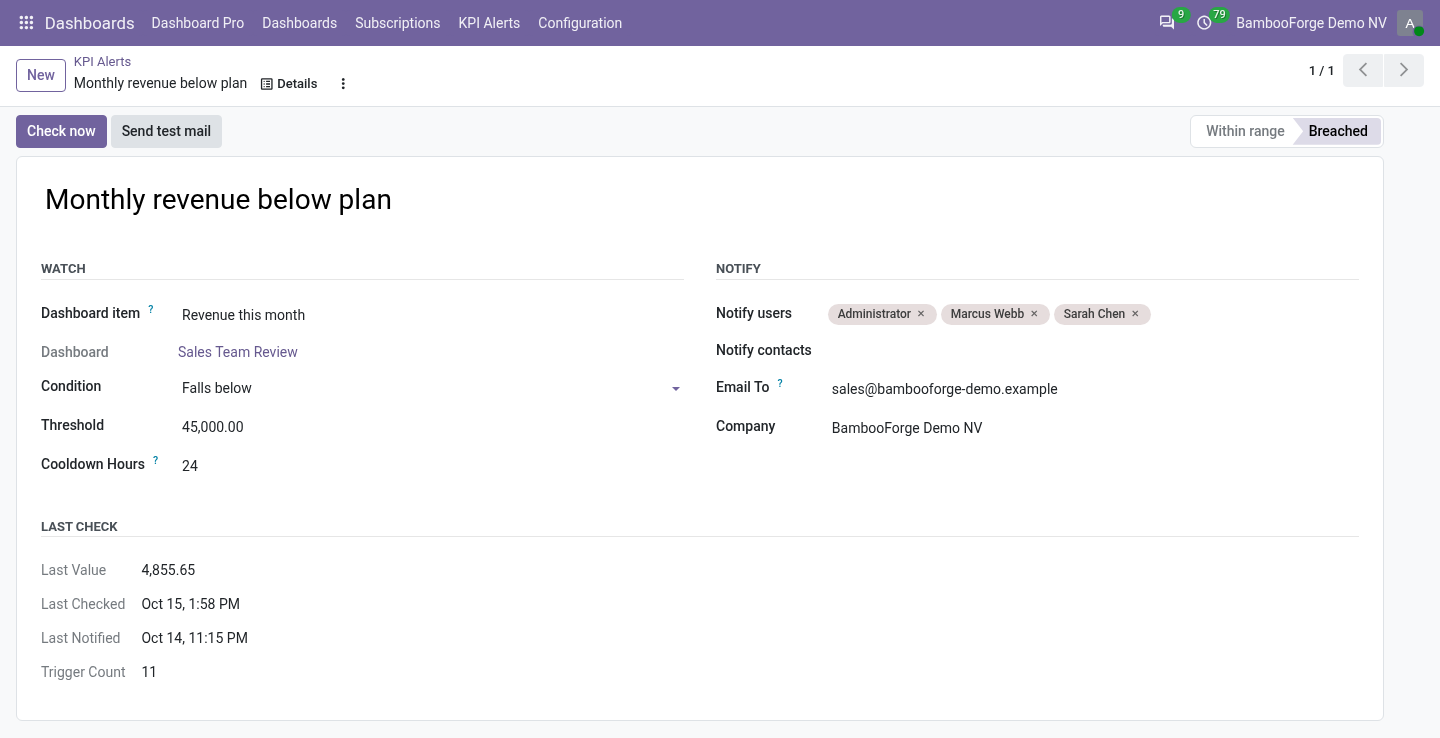
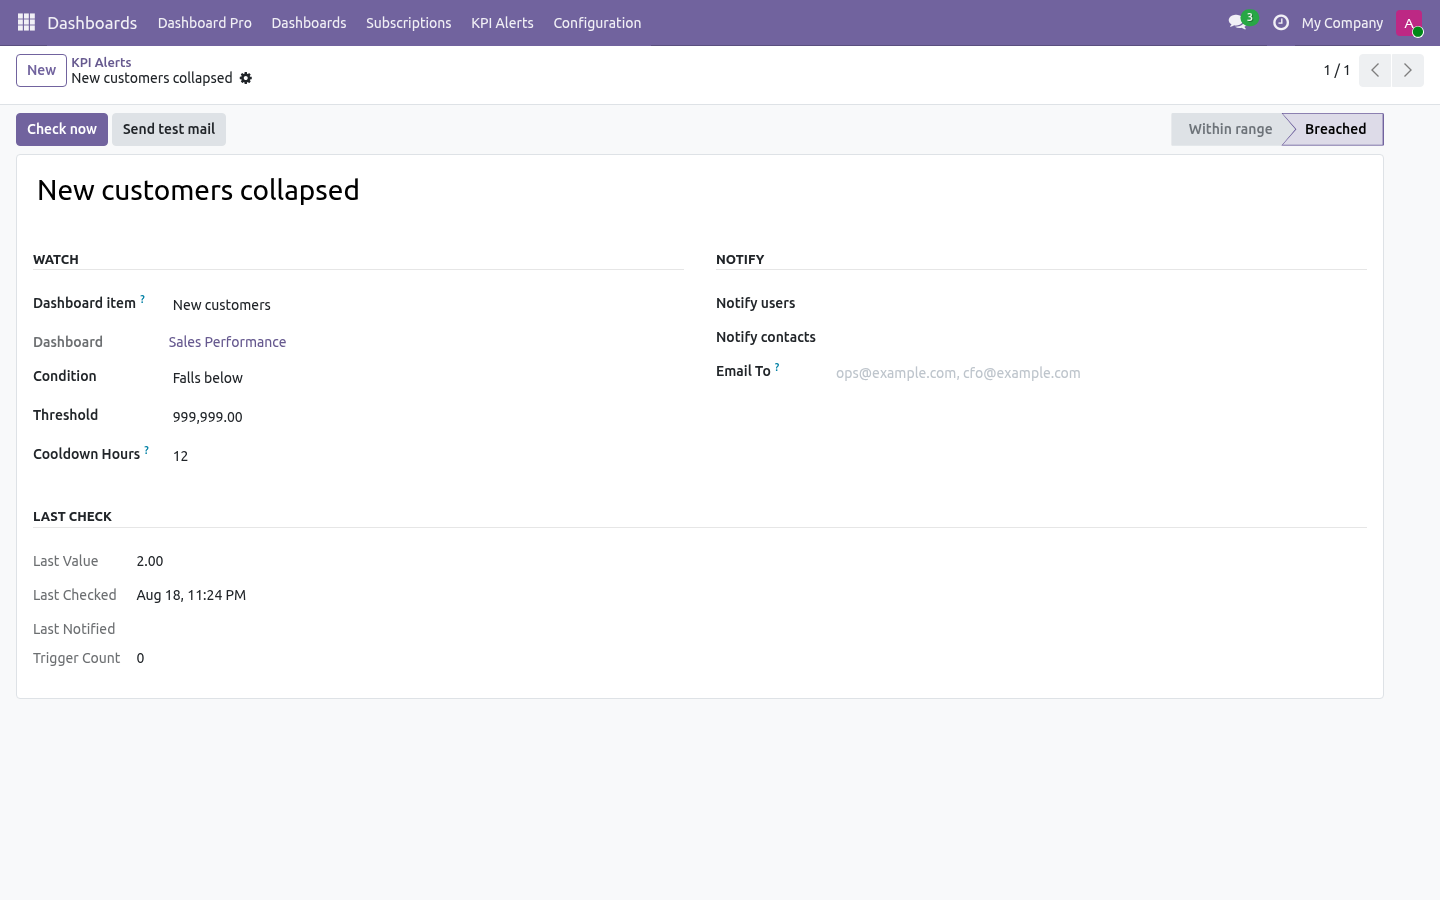
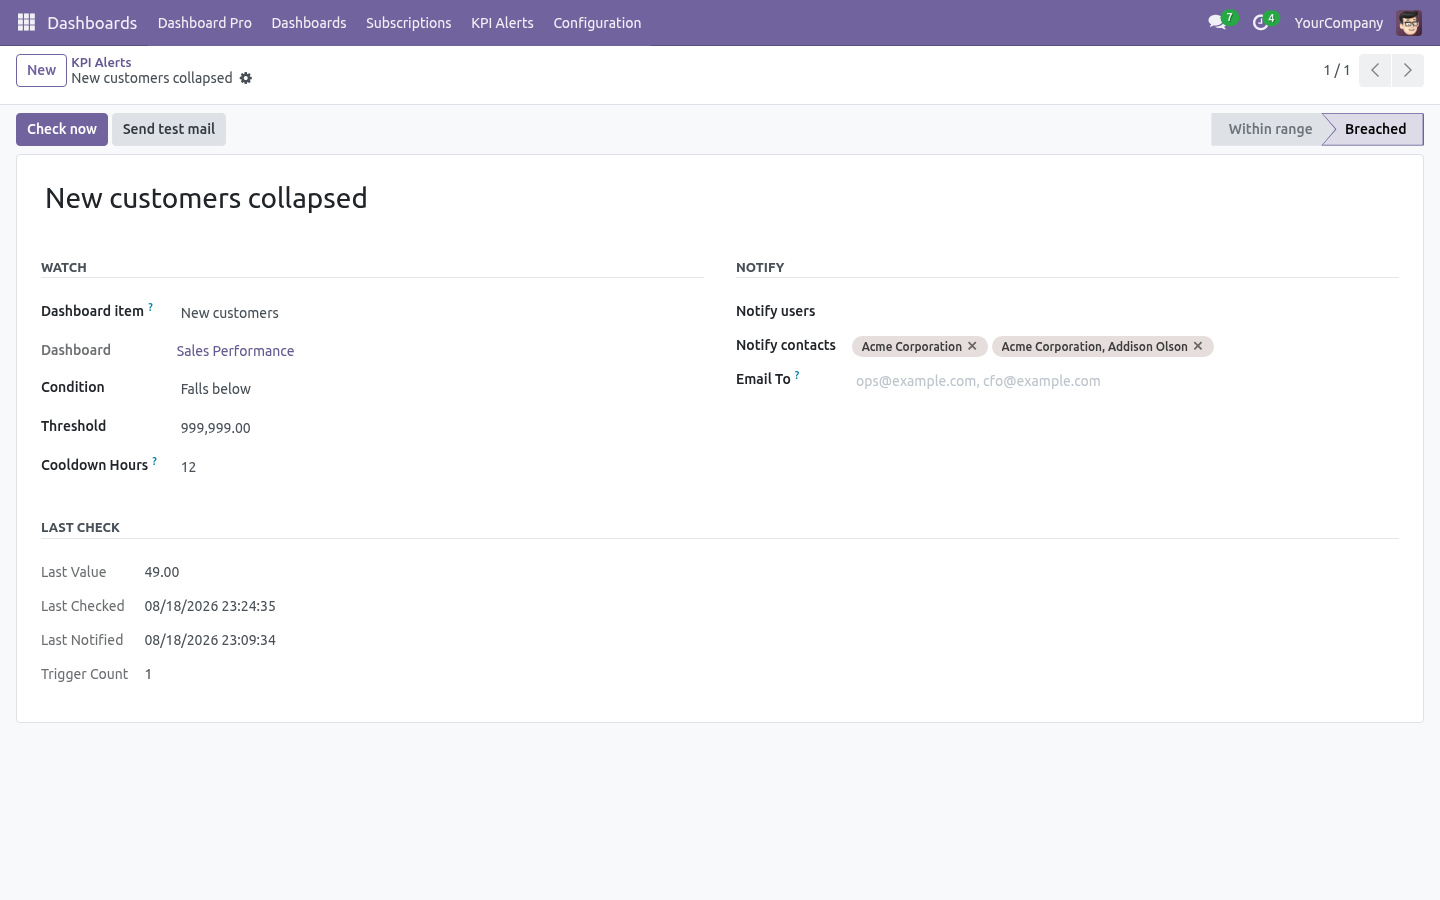
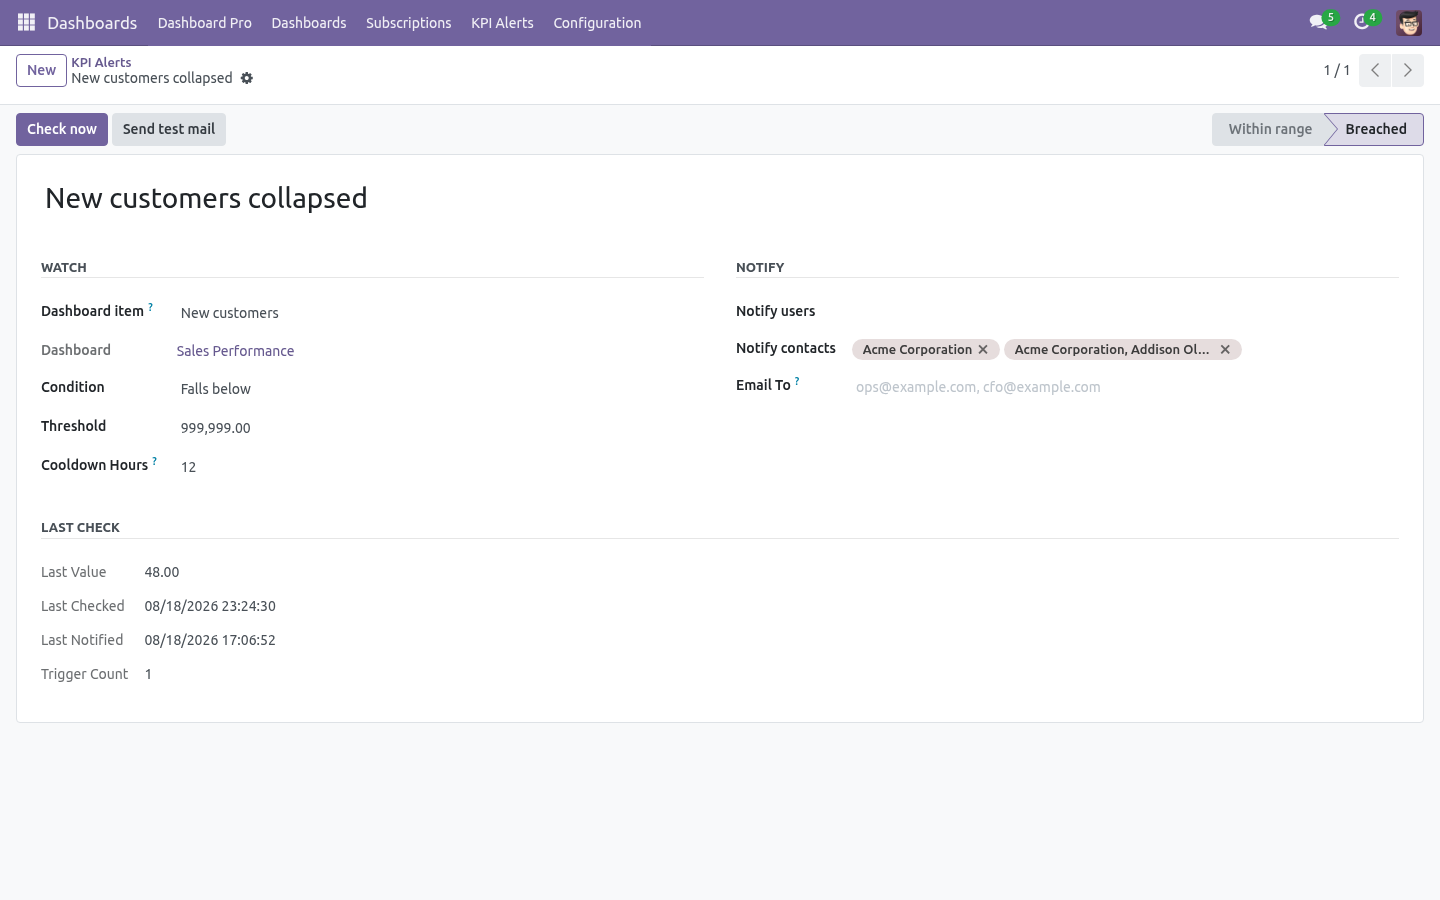
A subscription mails on a schedule; an alert mails when a number moves. Create one under Dashboards ▸ KPI Alerts: pick a KPI item, choose whether it matters when the value falls below or rises above your threshold, and set a cooldown so a value sitting on the line does not mail every hour. Recipients can be users, contacts or plain addresses — duplicates collapse. An hourly scheduled action checks every active alert; Check now and Send test mail are on the form for the impatient.
How we make sure it works
Before every release, 44 automated checks run against this app on Odoo 17, 18, 19 and 20. Among them:
Alert without recipients does not crash.
Outsider cannot read restricted item.
Idempotent no double send same period.
Not due subscription does not send.
No recipients not due.
The complete list is in the source you receive.