 BambooForge Labs
ABC-XYZ Inventory Analysis & Reorder Rules
ABC and XYZ classification for your catalogue, plus Min/Max reorder rules generated from a service level and safety-stock days.
Available for Odoo 16.0, Odoo 17.0, Odoo 18.0, Odoo 19.0, Odoo 20.0. Technical name bambooforge_abc_analysis.
Transcript of the walkthrough (Odoo 20)
ABC-XYZ Inventory Analysis & Reorder Rules. ABC and XYZ classification for your catalogue, plus Min/Max reorder rules generated from a service level and safety-stock days. Two complementary classifications, combined: In the next few minutes: abc-xyz inventory analysis & reorder rules, then quick start, then reading the matrix, then how classification works, then tuning the thresholds. Then what this app deliberately does not do, so you can tell before you buy whether it fits.
Everything lives under ABC-XYZ then Products then Analyses then Reorder Policies. No Enterprise modules and no external Python libraries are required. ABC-XYZ Inventory Analysis & Reorder Rules. Stop treating every product the same.
This app ranks your catalogue by value (ABC / Pareto) and by demand predictability (XYZ), combines the two into an actionable ABC-XYZ matrix with a stocking recommendation per cell, keeps a snapshot of every run, and writes the classes back onto your products so you can filter and act on them across Inventory. This page is the complete manual. Follow it top to bottom and you can install, run your first analysis, read the matrix, tune the thresholds, automate refreshes and fix the common issues without contacting support. Quick start.
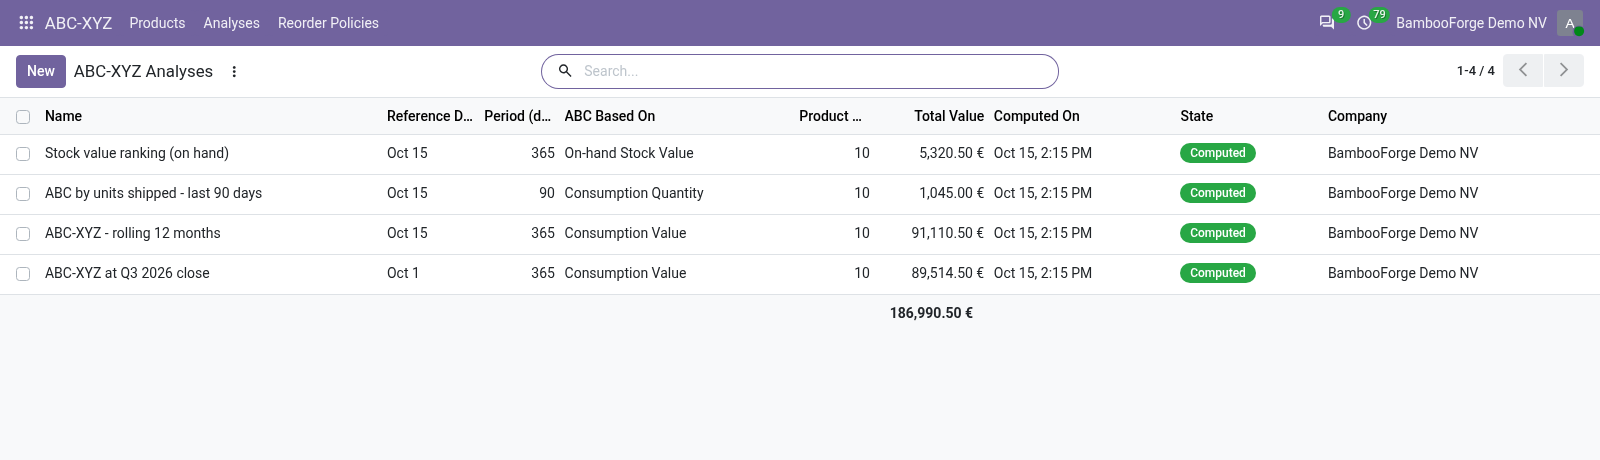
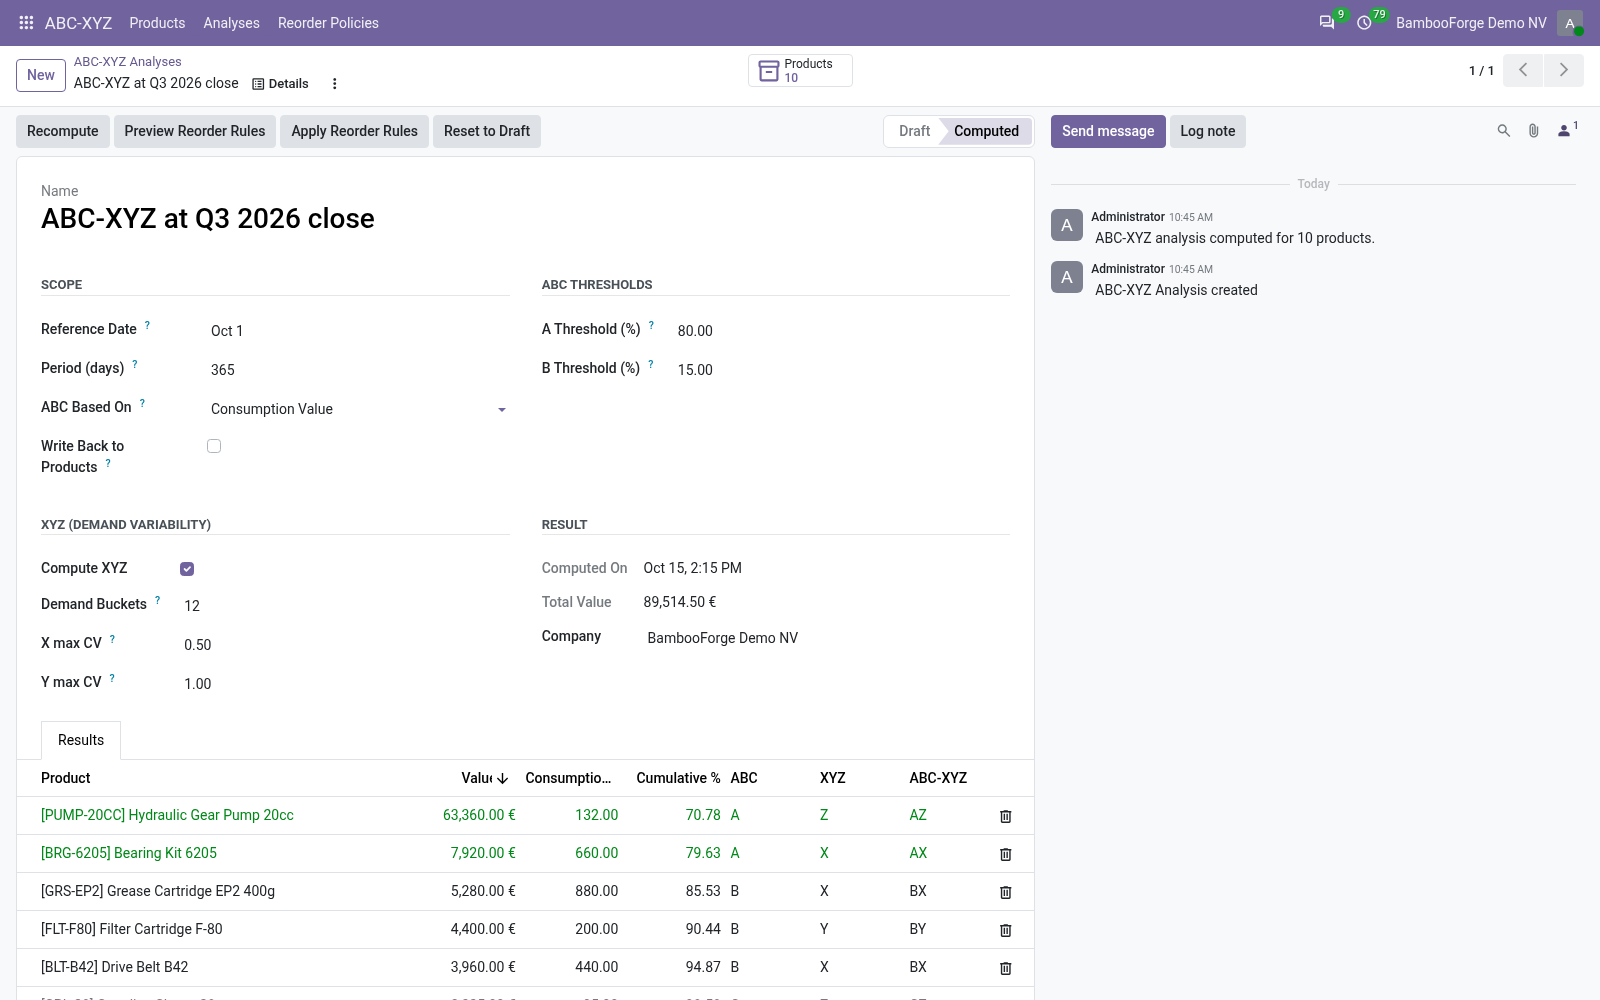
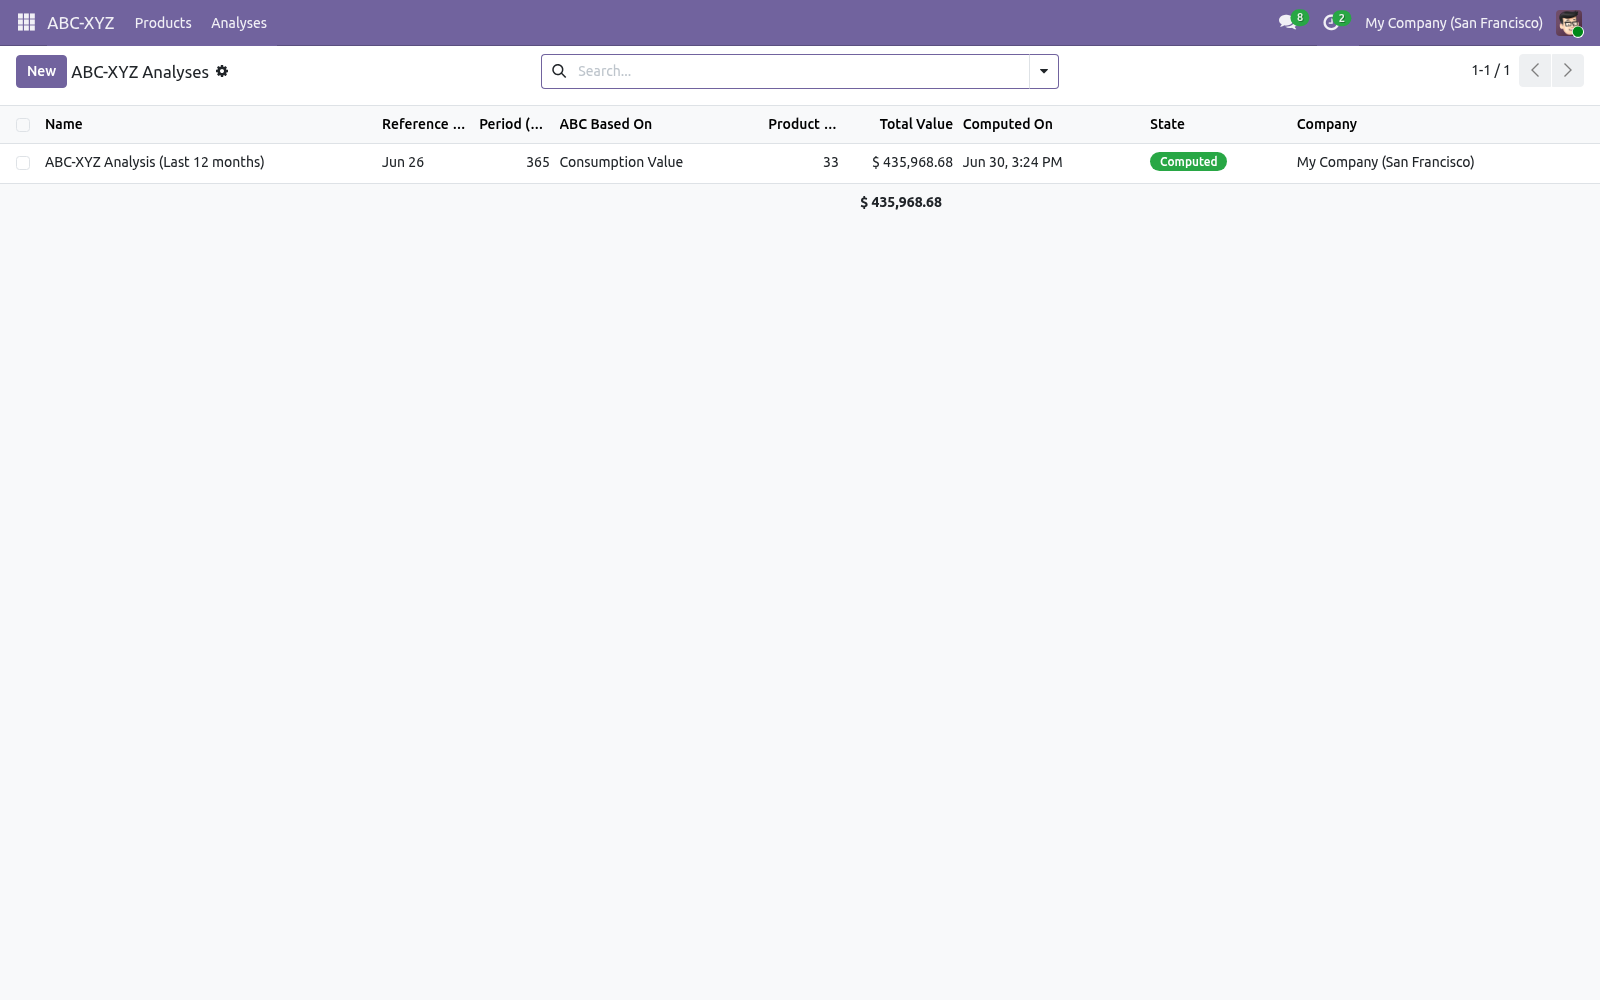
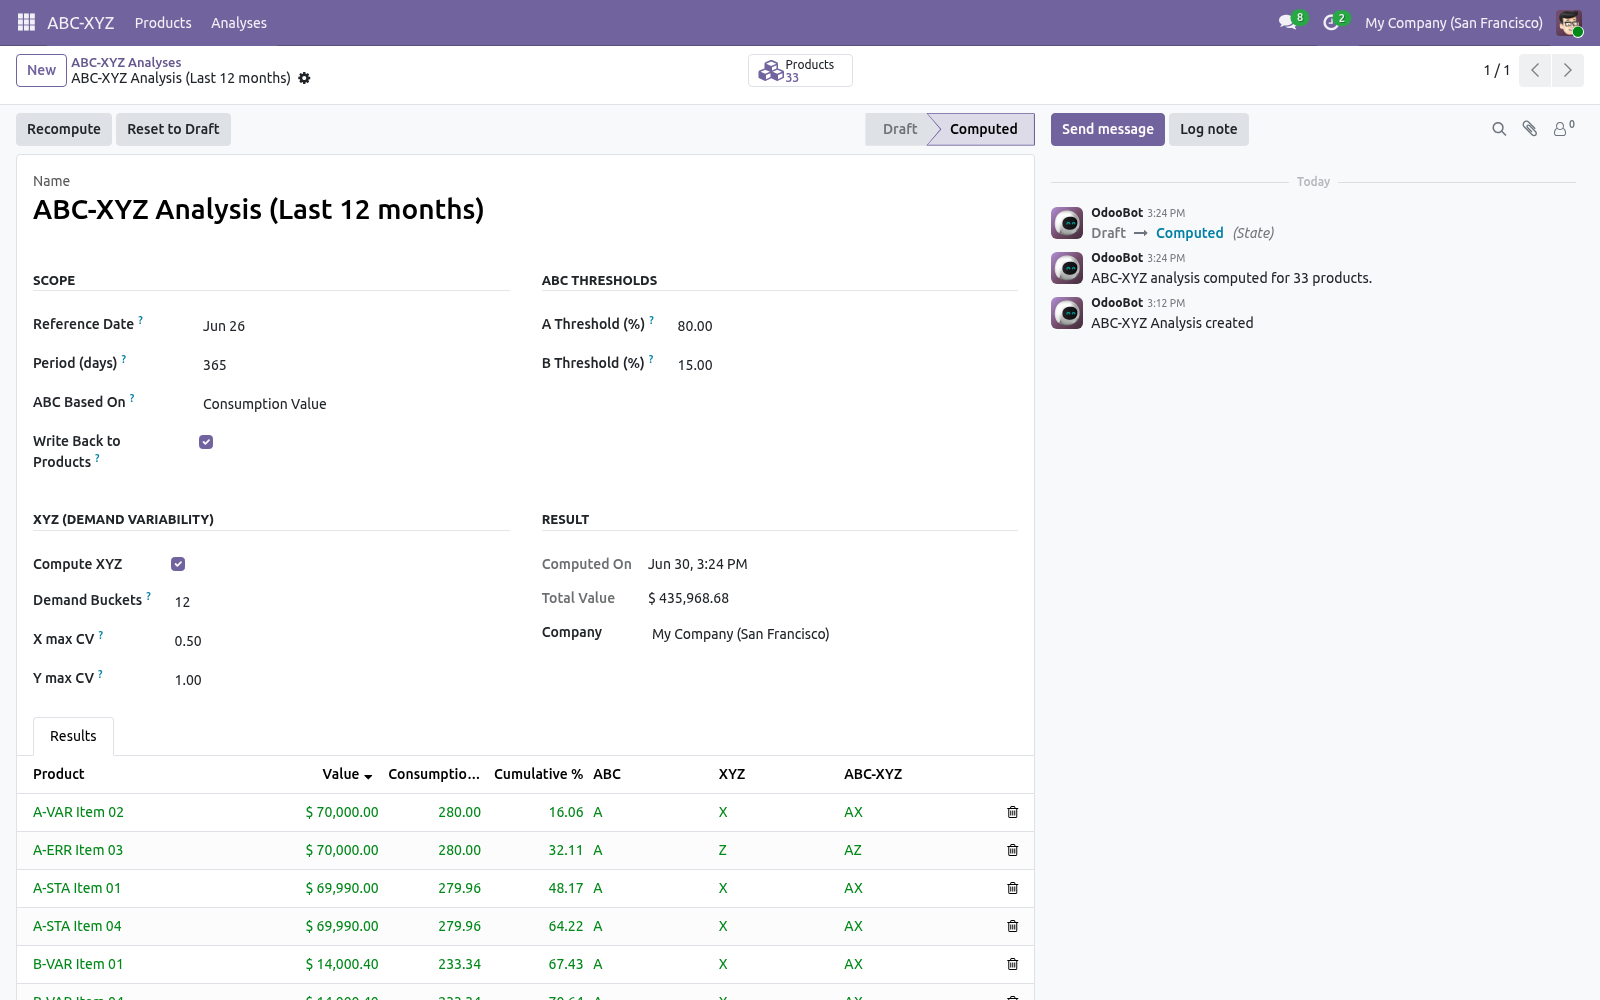
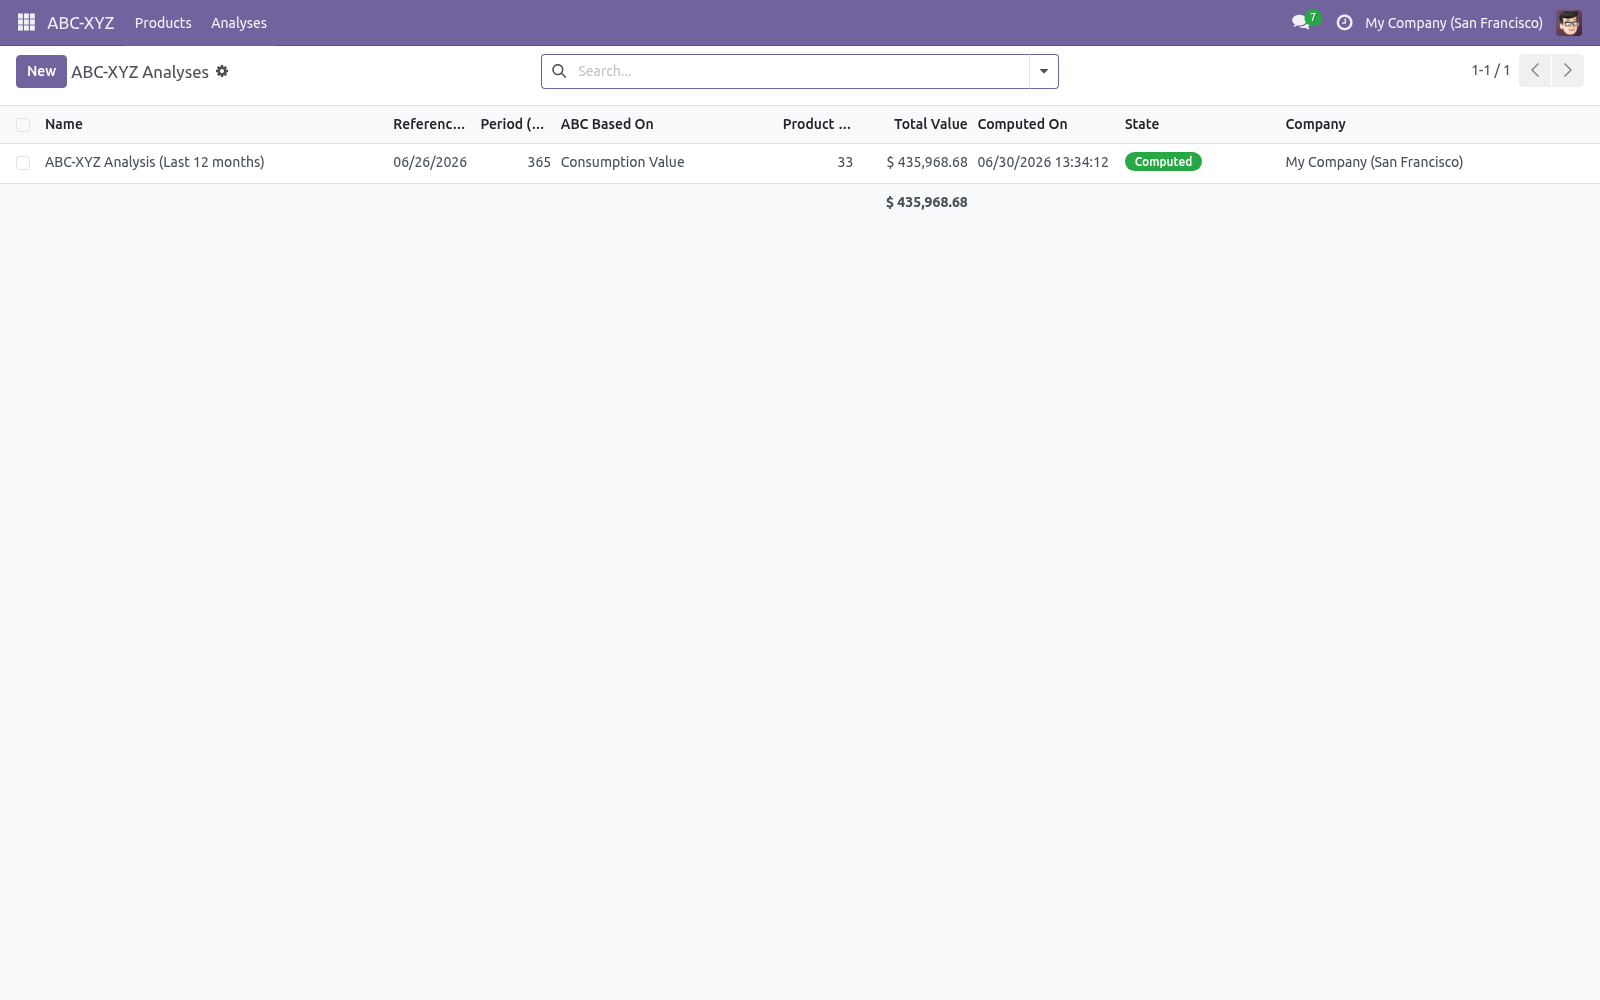
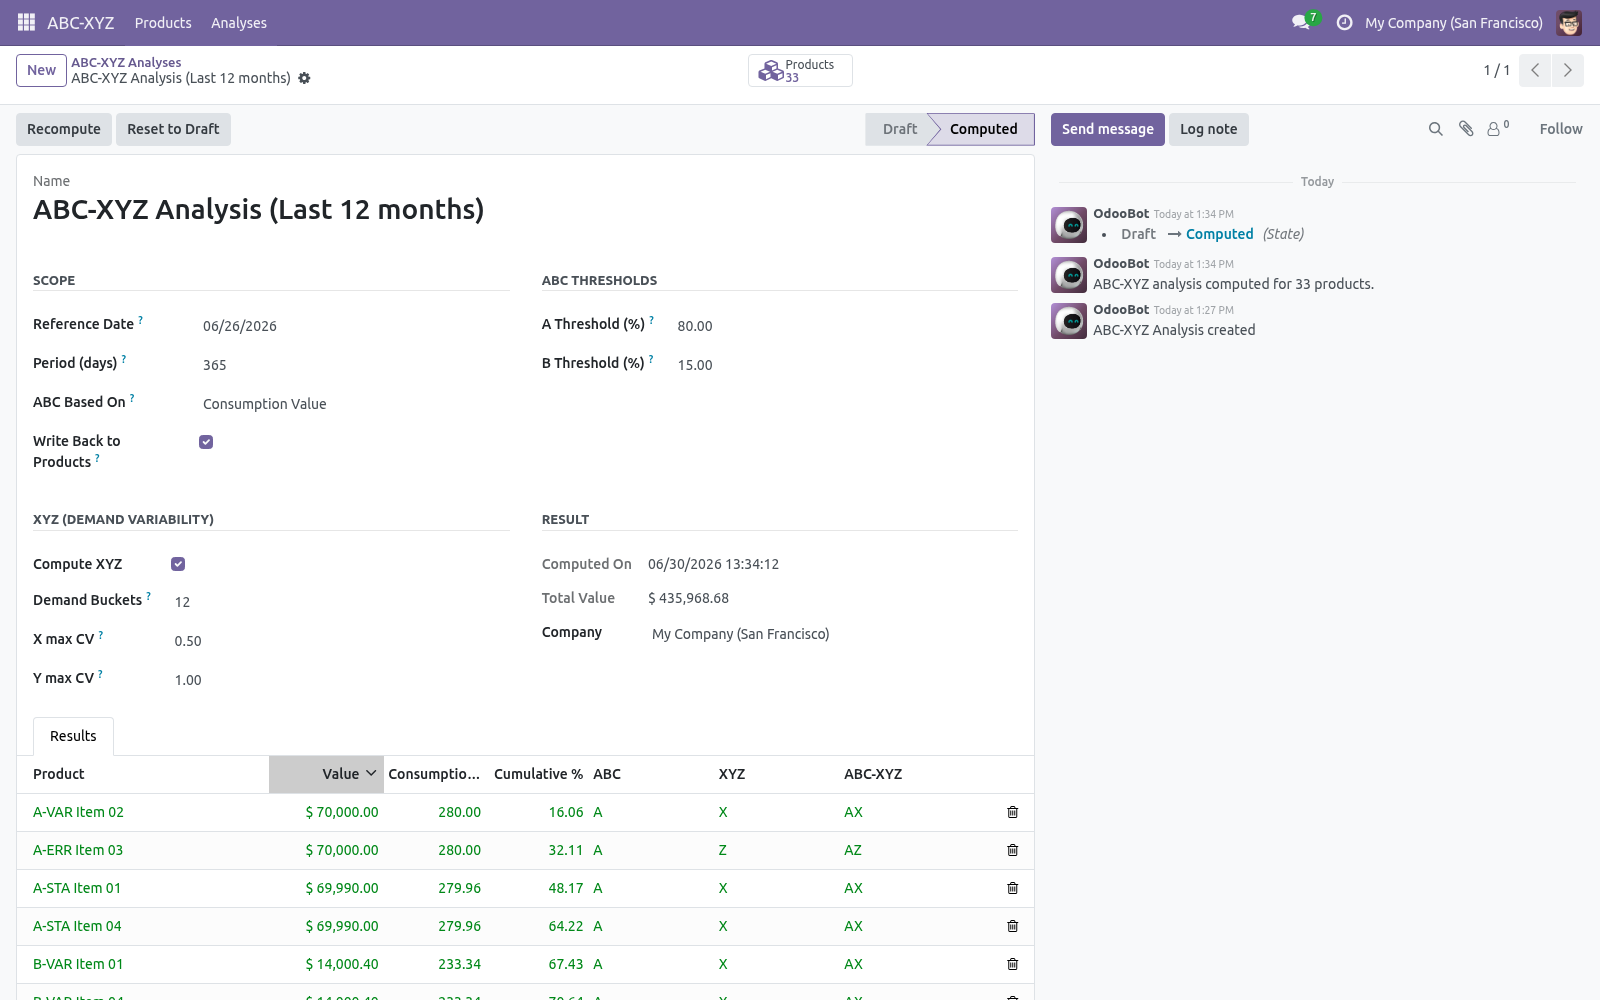
1. Open ABC-XYZ > Analyses and click New. 2. Set the Reference Date and the Period (days) to analyse (365 is a good default).
3. Choose the ABC Based On metric: Consumption Value — quantity delivered to customers × cost (the classic choice). Consumption Quantity — units delivered, ignoring cost. On-hand Stock Value — current quantity on hand × cost.
4. Leave Compute XYZ ticked to also classify demand variability. 5. Click Compute.
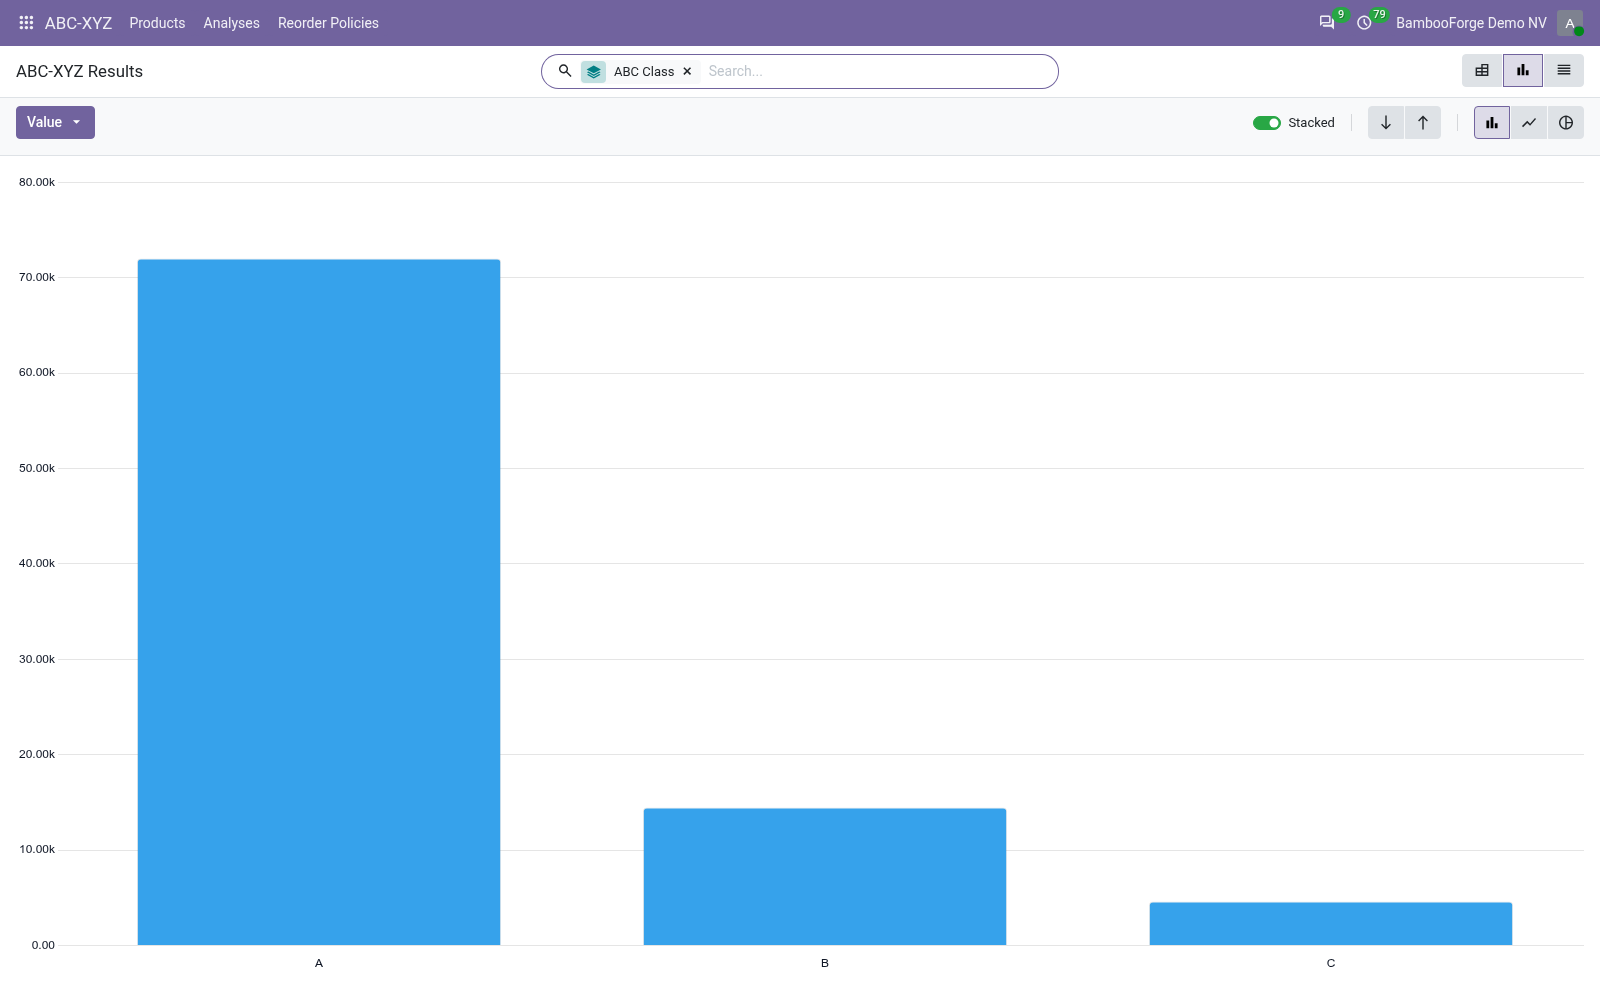
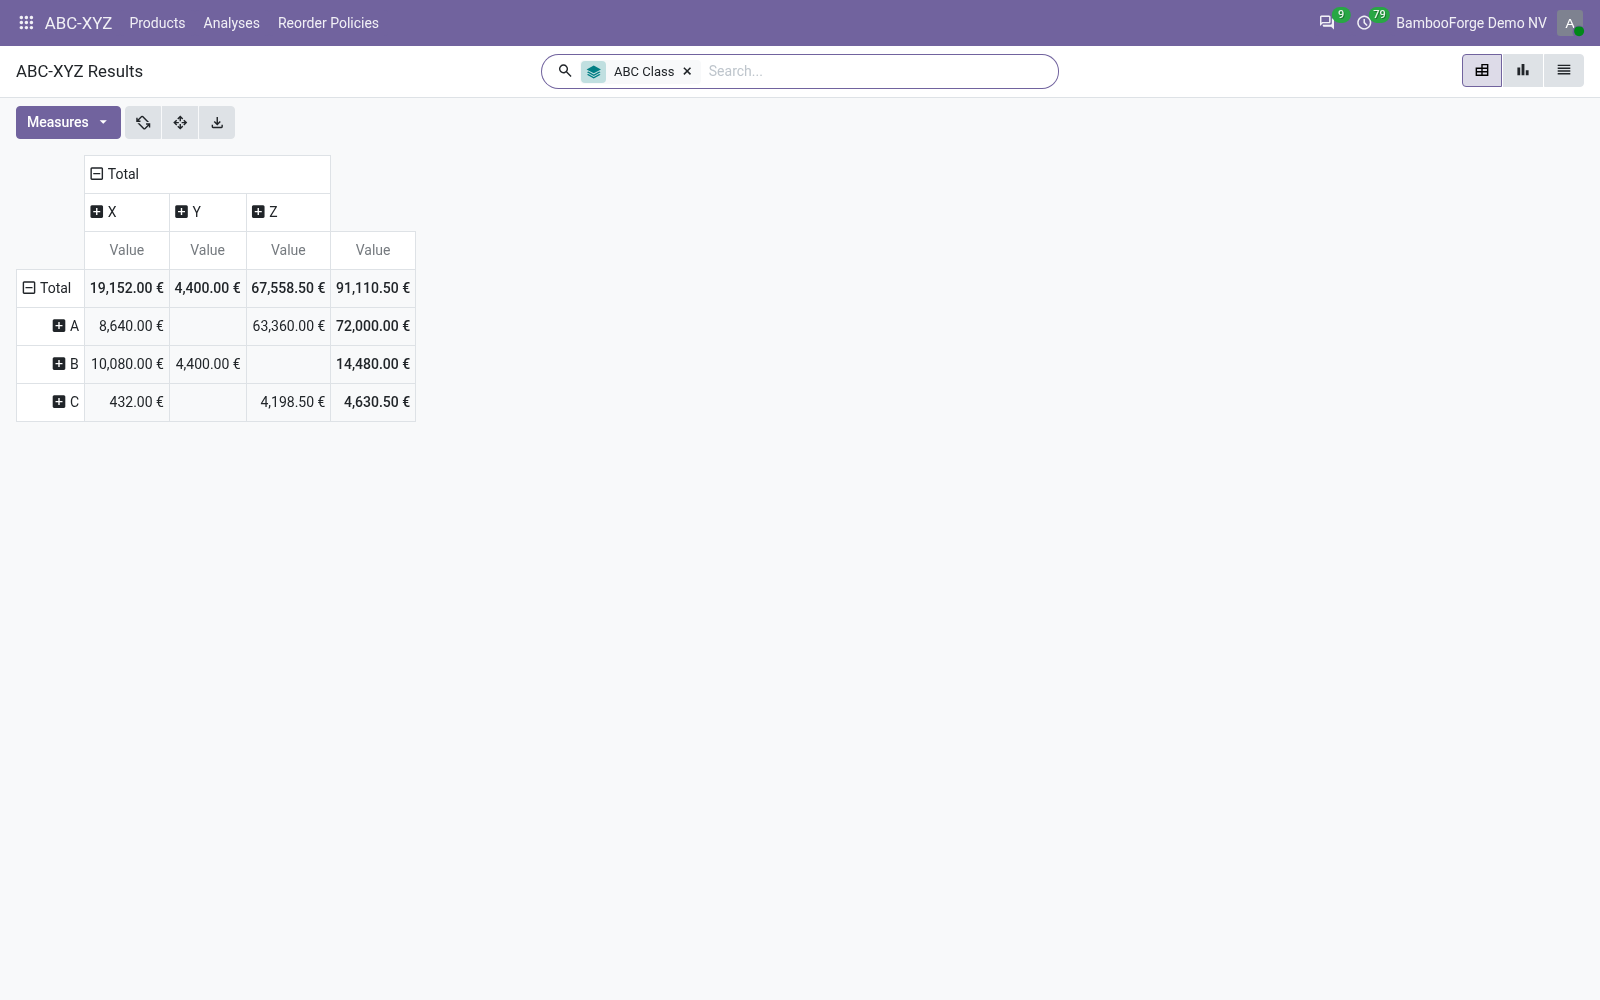
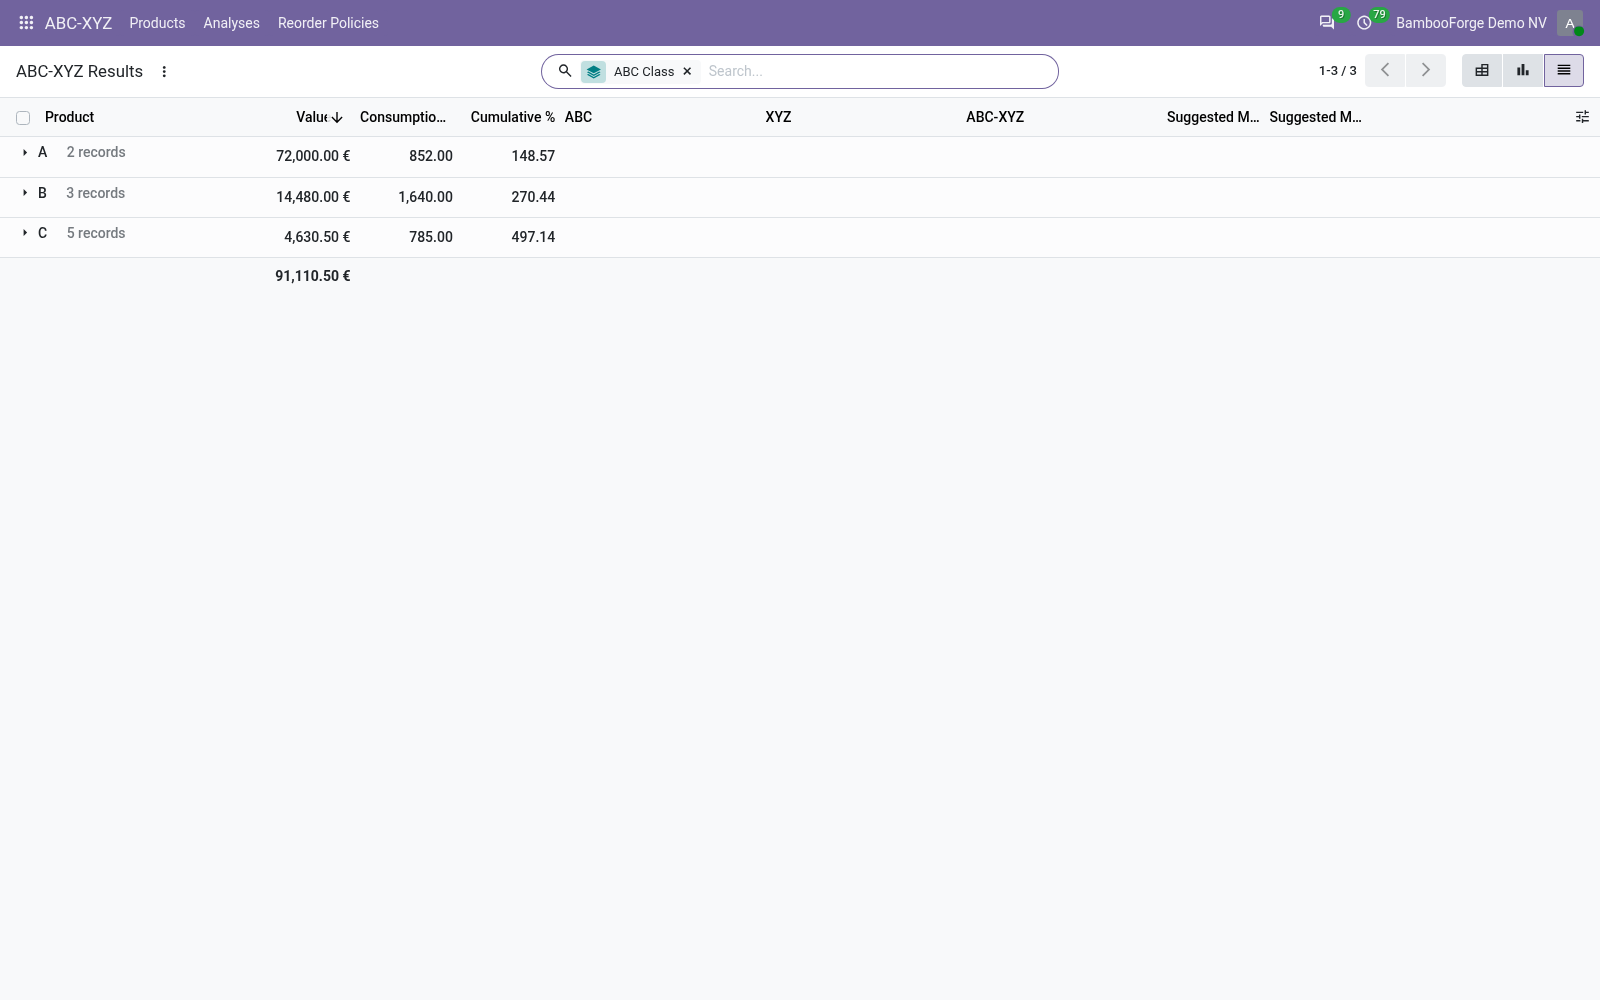
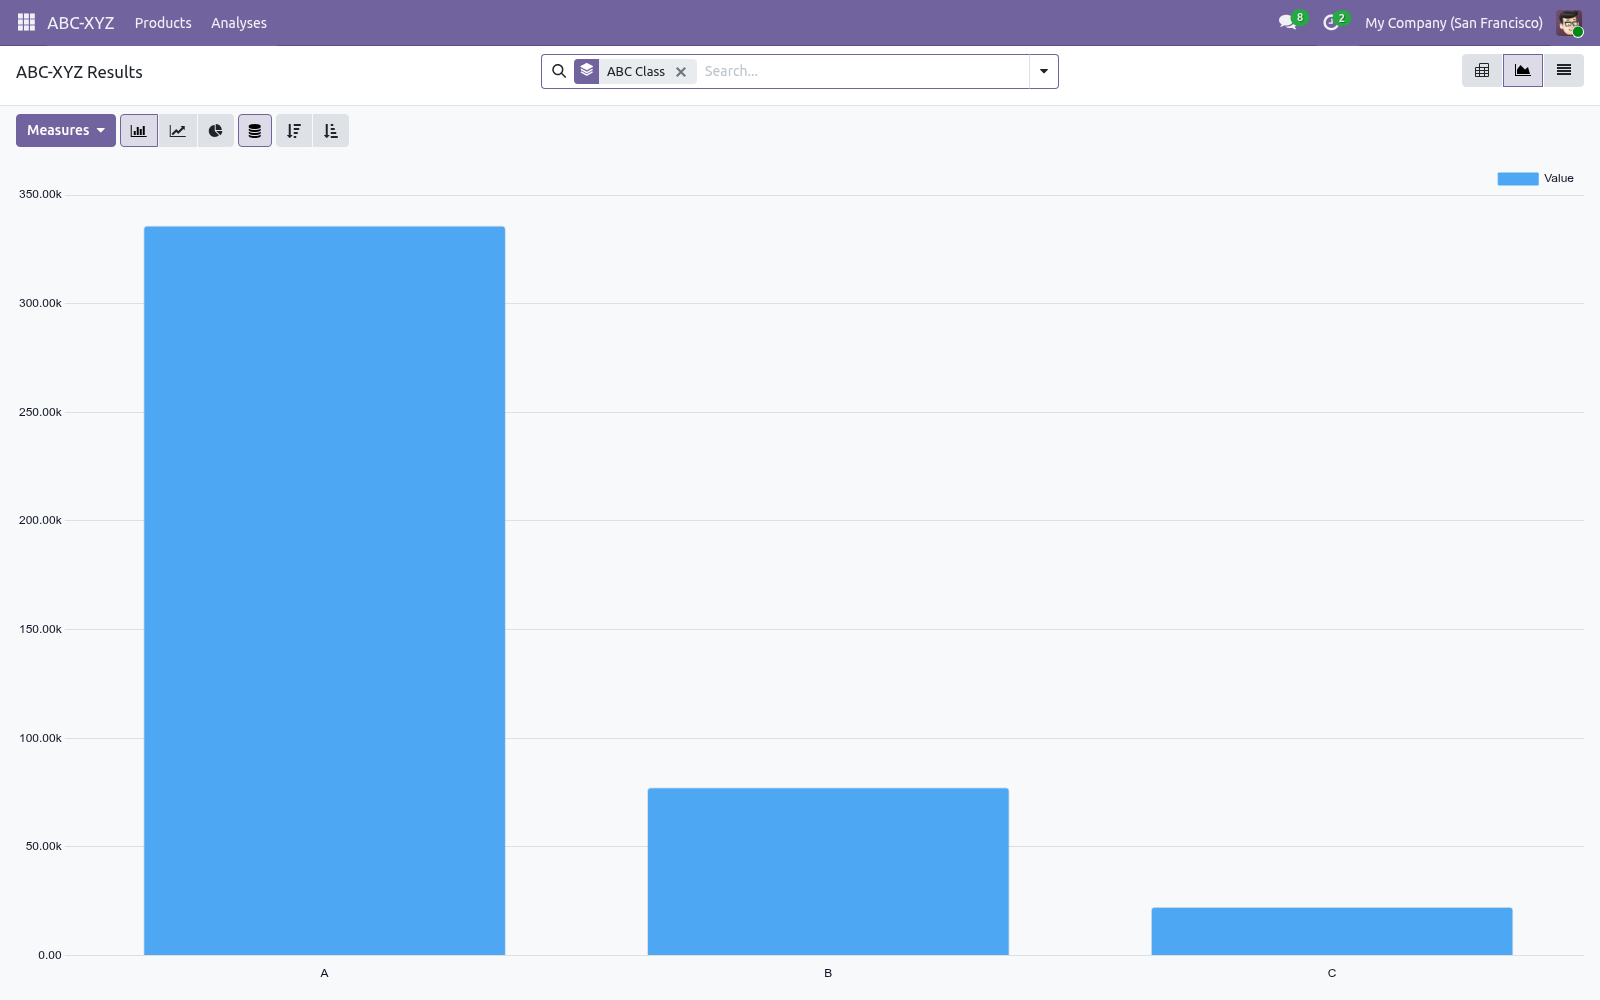
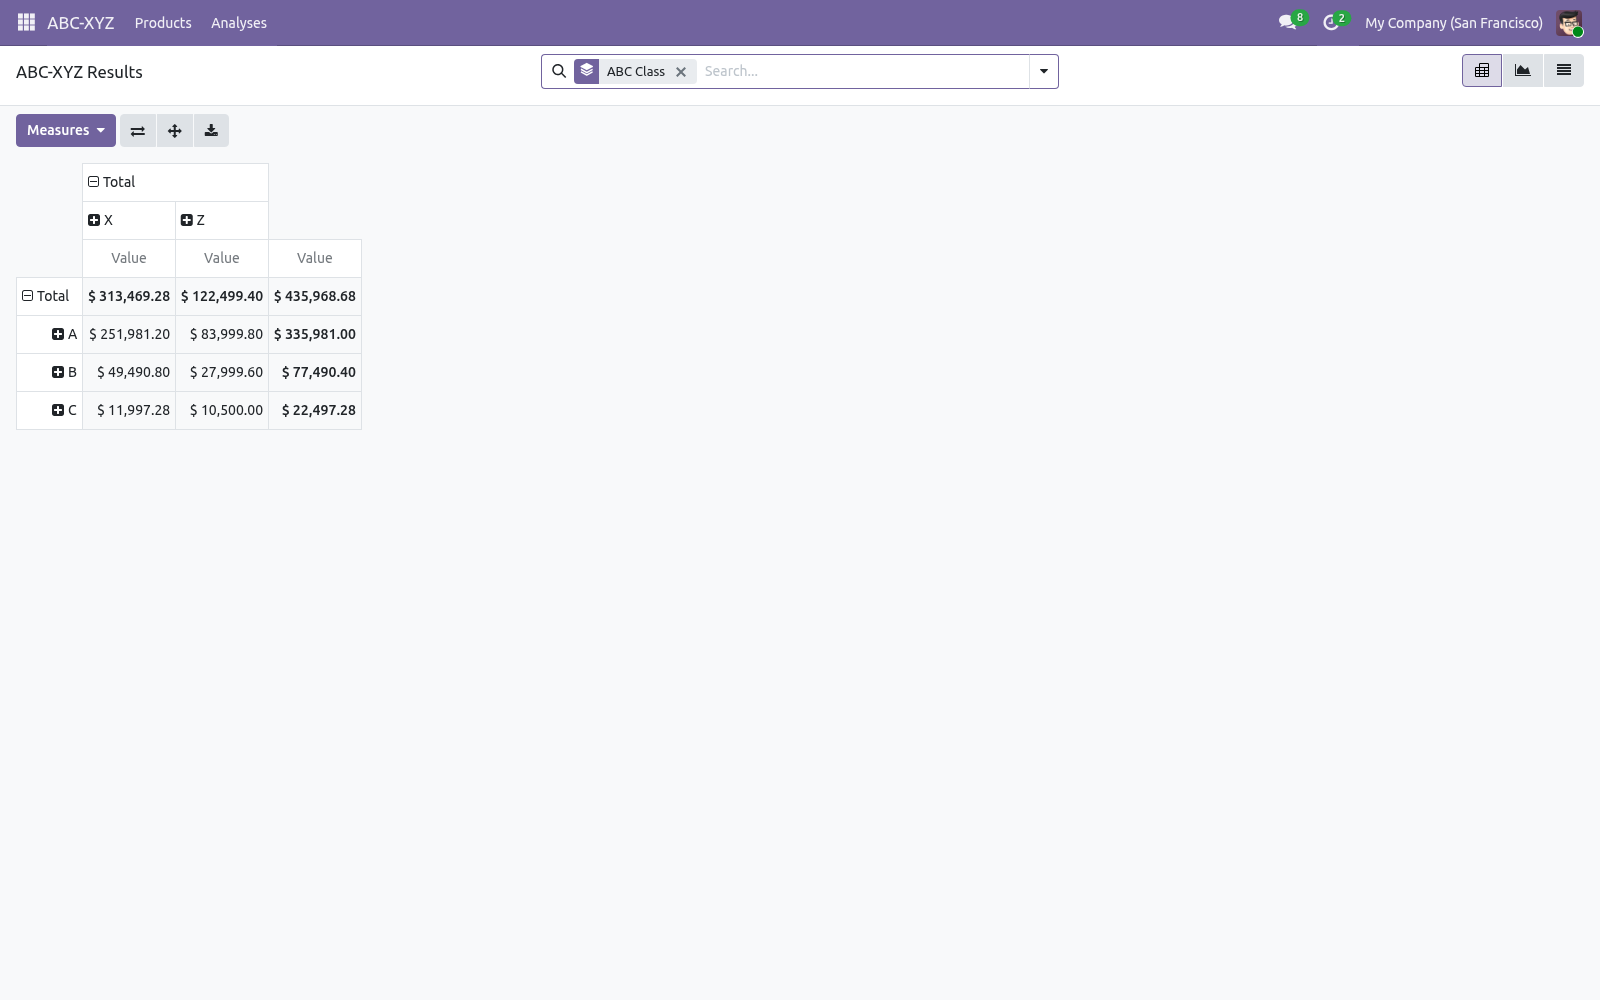
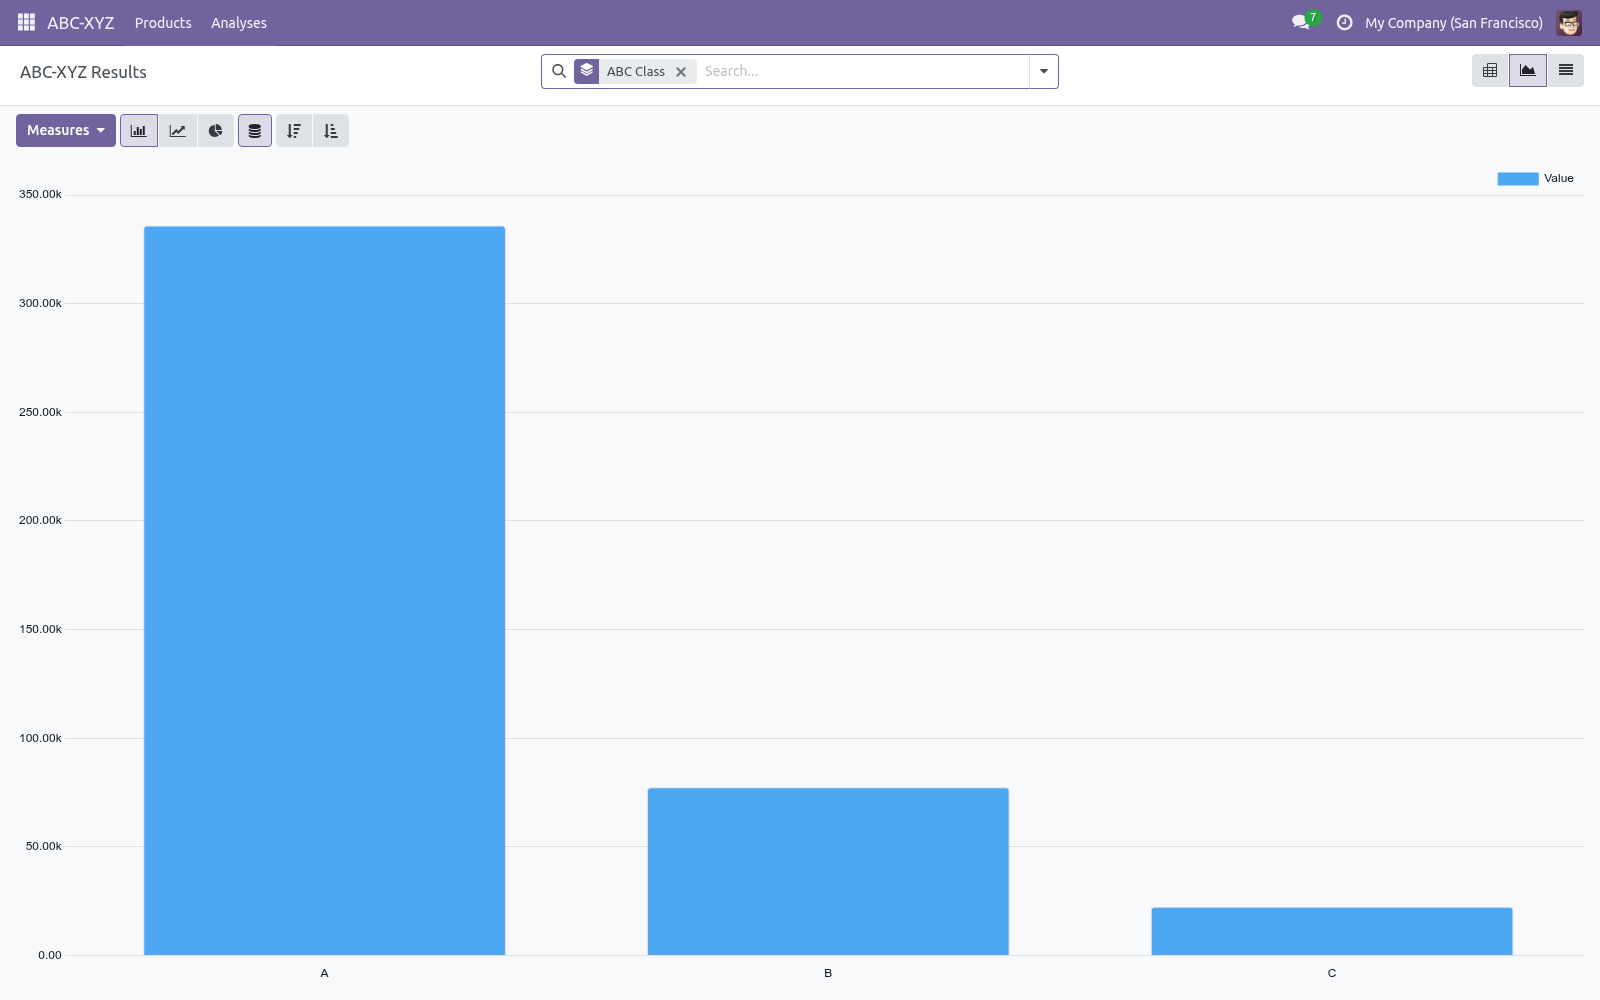
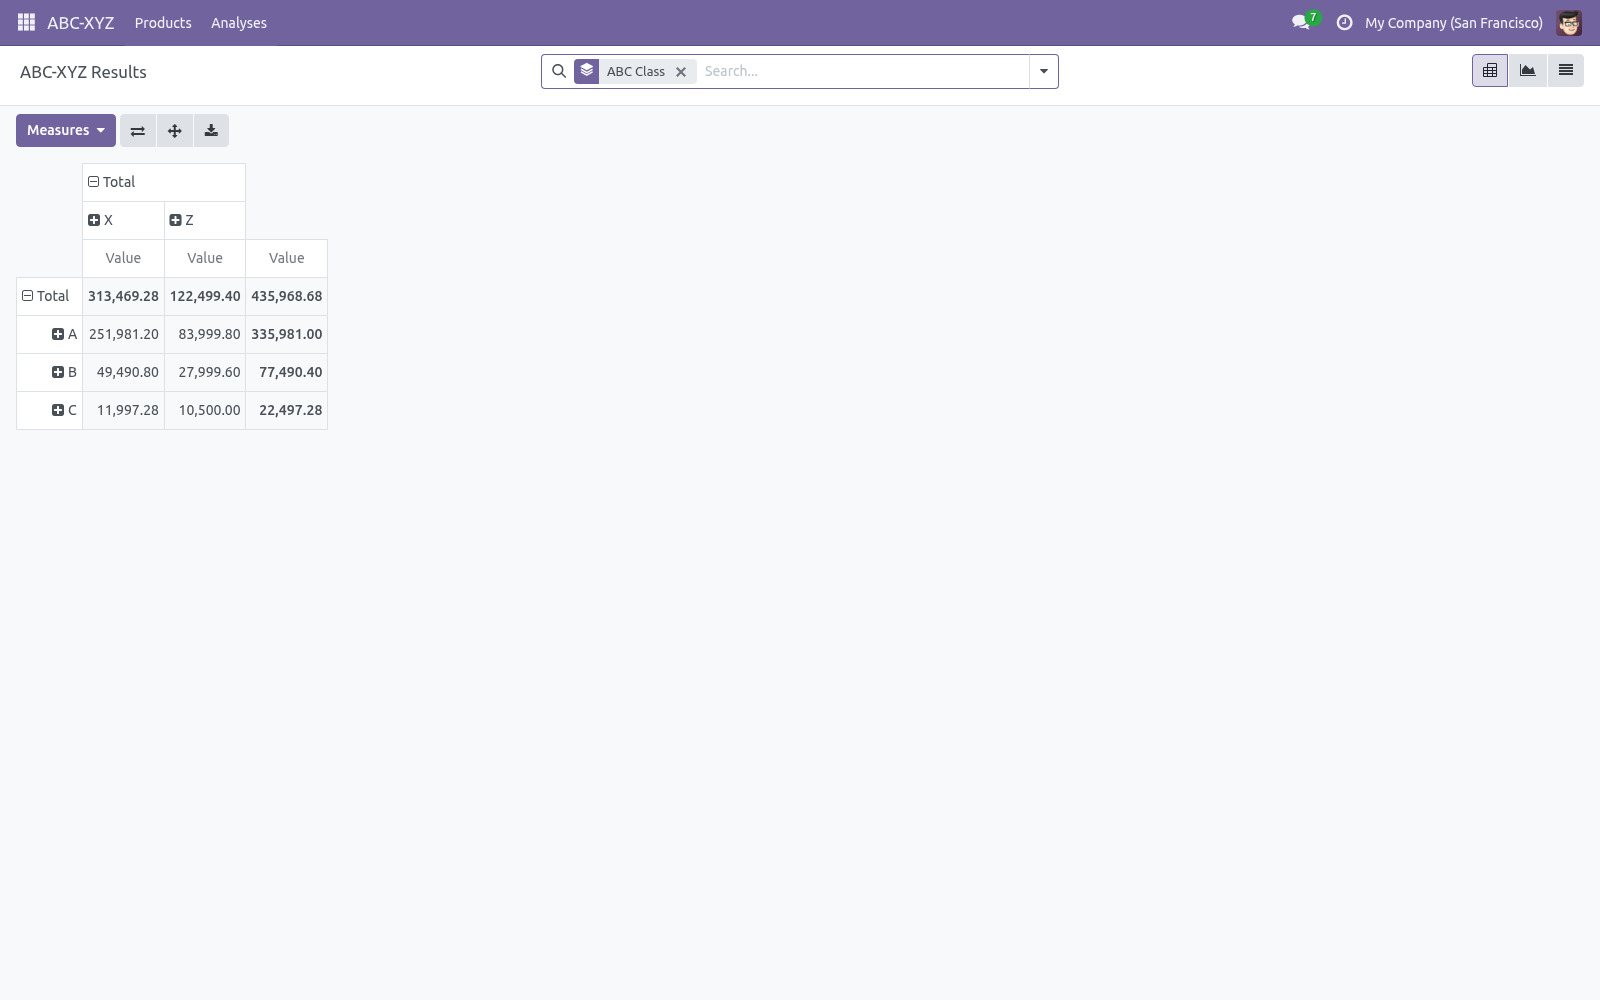
Reading the matrix. Open an analysis and use the Products stat button, or go to ABC-XYZ > Products: Pivot — ABC classes down the side, XYZ classes across the top, value in each cell. This is your ABC-XYZ matrix: where does value sit, and how predictable is it? Graph — value per ABC-XYZ cell at a glance.
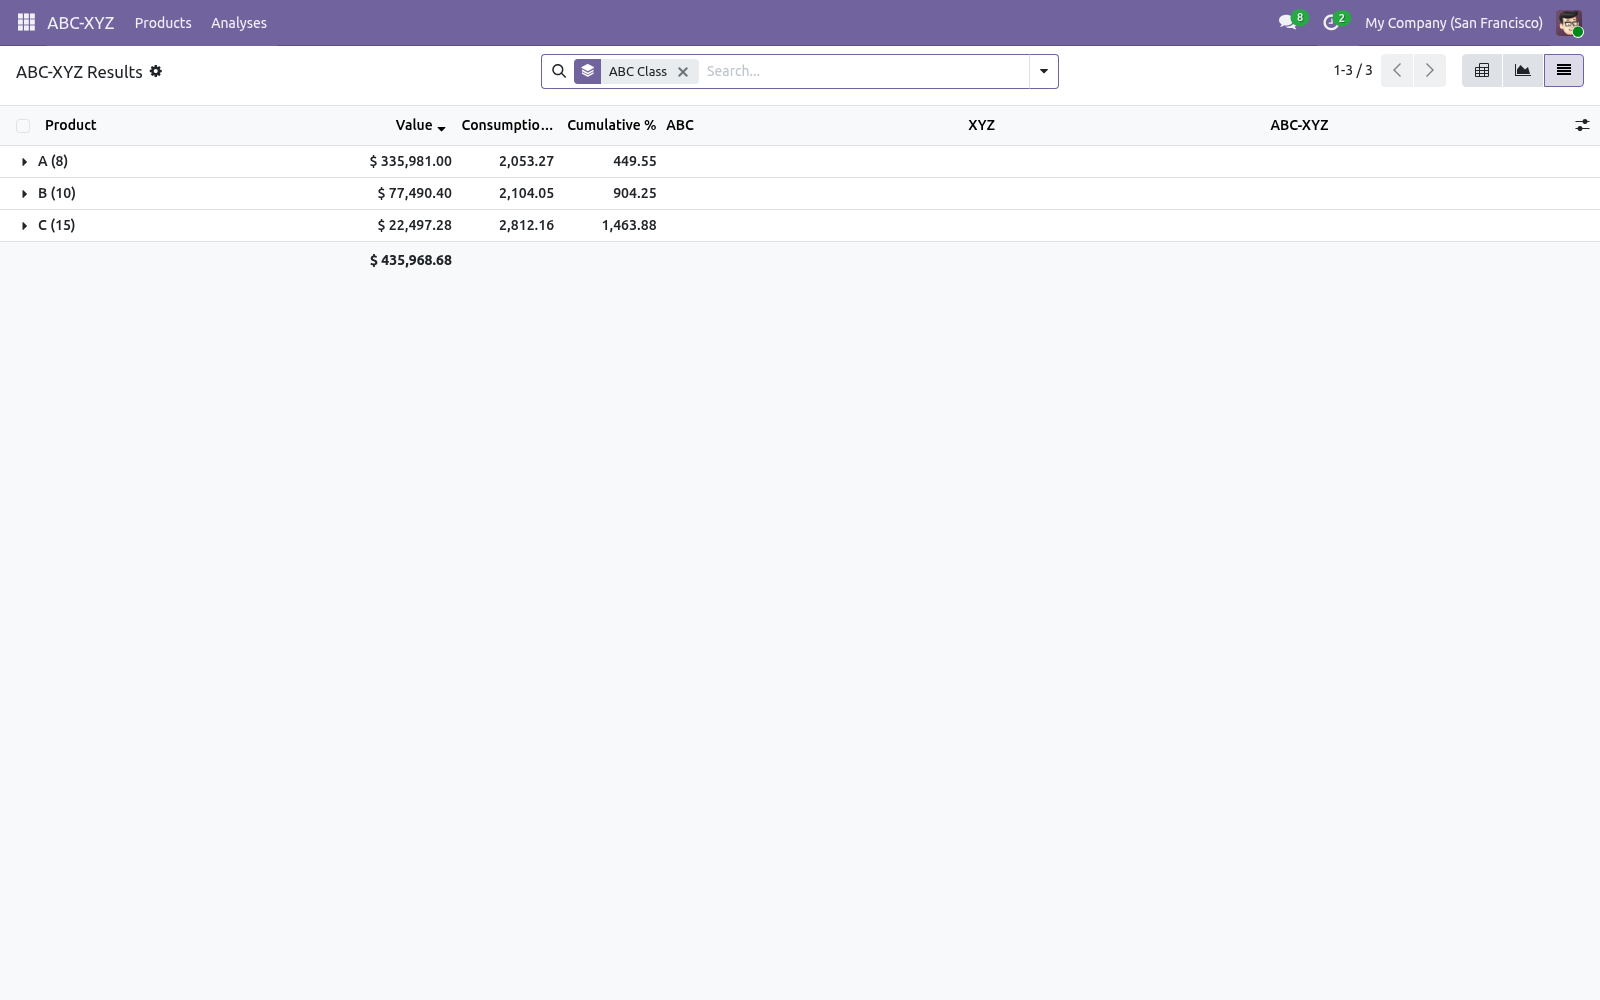
List — every product with its value, cumulative share, ABC, XYZ, combined cell and the recommended stocking policy. How classification works. ABC. Products are sorted by the chosen metric, highest first.
Running totals give each product a cumulative share. Products are class A until the cumulative share reaches the A Threshold (default 80%), class B up to the A + B Threshold (default 80 + 15 = 95%), and C beyond. XYZ. The period is split into Demand Buckets (default 12, i.e.
monthly over a year). For each product the coefficient of variation (CV = standard deviation / mean) of demand across the buckets is measured. CV up to X max CV is X (stable), up to Y max CV is Y (variable), above is Z (erratic). Products with no movement fall into Z.
Tuning the thresholds. Re-run the analysis after any change; results update immediately. A / B Thresholds — move the Pareto cut-offs (their sum must stay below 100). Demand Buckets — more buckets = finer variability detection (needs enough history).
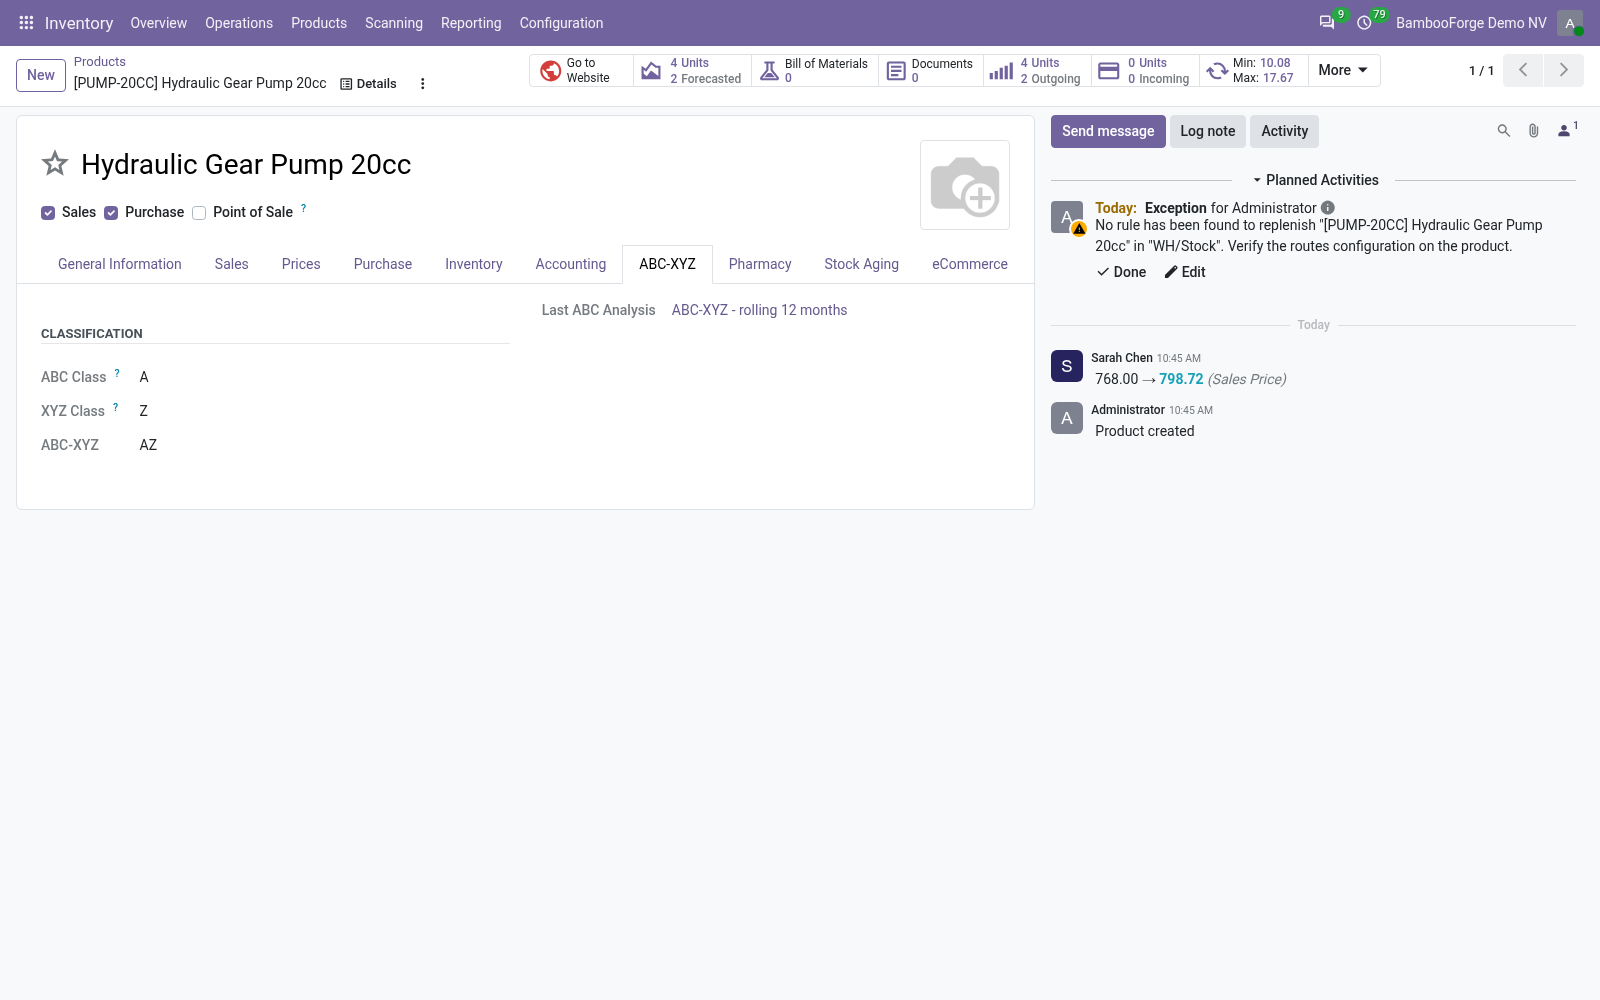
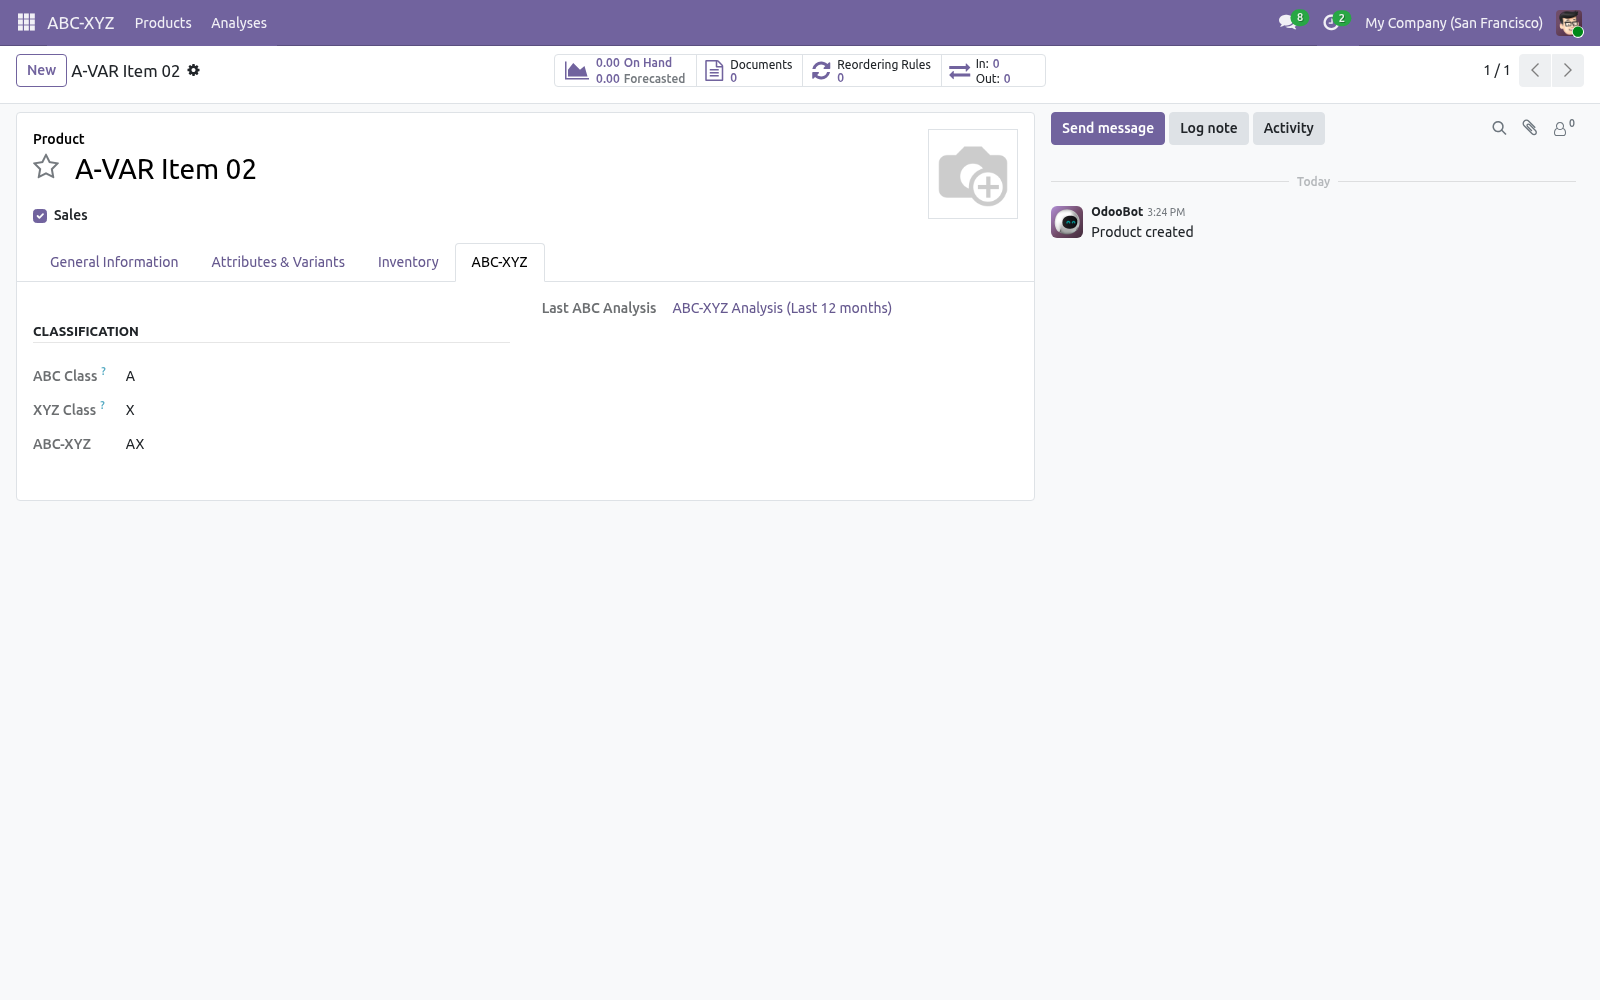
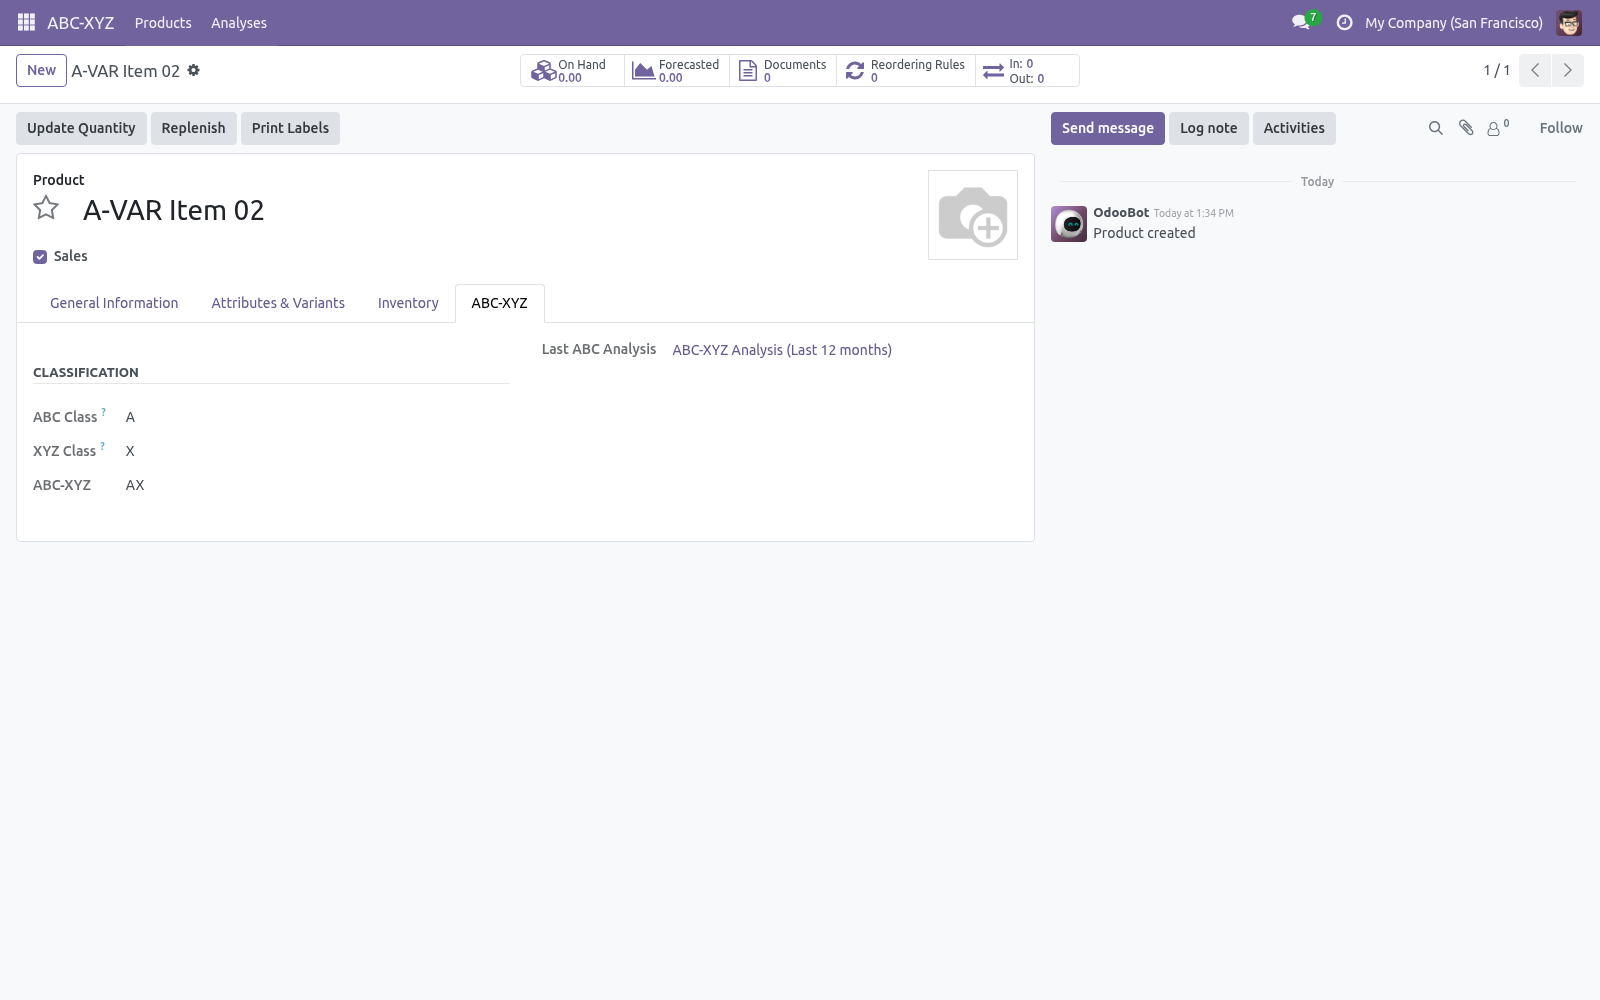
X max CV / Y max CV — tighten or loosen what counts as stable vs erratic. Acting on the classes. When Write Back to Products is on, every product gets an ABC-XYZ tab showing its classes and the analysis it came from, plus filterable fields. In the product list (Inventory > Products): 1.
Group by ABC Class or XYZ Class (search panel > Group By). 2. Filter to ABC Class A or Erratic Demand (Z). 3.
Act on the selection — set reordering rules, adjust safety stock, review suppliers, or plan a phase-out. Recommended policies. Each result line carries a recommended stocking policy for its cell, for example: AX — high value, stable: tight control, automate continuous replenishment, low safety stock. AZ — high value, erratic: make-to-order where possible, careful forecasting.
CZ — low value, erratic: consider phase-out or pure make-to-order. Automating refreshes. A scheduled action ABC-XYZ: Recompute Latest Analysis ships disabled. Enable it under Settings > Technical > Scheduled Actions to recompute the most recent analysis per company on a schedule (weekly by default), moving the reference date to today each run.
Frequently asked questions. A product is missing from the results. For consumption bases, only products with deliveries to customers in the period appear. For the on-hand stock value basis, products with stock on hand are included.
Everything is class A (or class C). The ABC split depends on spread. Check the A/B thresholds and that your cost prices are set, since value = quantity × cost. How we make sure it works.
Before every release, 21 automated checks run against this app on Odoo 16, 17, 18, 19 and 20. Among them: Defaults do not write orderpoints by themselves. Preview does not write when auto off. Manual orderpoint not touched.
A shipment after the company's midnight stays out. Reapply updates no duplicate. The complete list is in the source you receive. The complete manual is at docs dot bambooforge dot dev, the demo database is linked from the store page, and support answers within twenty-four hours.
Links are in the description.
Transcript of the walkthrough (Odoo 19)
ABC-XYZ Inventory Analysis & Reorder Rules. ABC and XYZ classification for your catalogue, plus Min/Max reorder rules generated from a service level and safety-stock days. Two complementary classifications, combined: In the next few minutes: abc-xyz inventory analysis & reorder rules, then quick start, then reading the matrix, then how classification works, then tuning the thresholds. Then what this app deliberately does not do, so you can tell before you buy whether it fits.
Everything lives under ABC-XYZ then Products then Analyses then Reorder Policies. No Enterprise modules and no external Python libraries are required. ABC-XYZ Inventory Analysis & Reorder Rules. Stop treating every product the same.
This app ranks your catalogue by value (ABC / Pareto) and by demand predictability (XYZ), combines the two into an actionable ABC-XYZ matrix with a stocking recommendation per cell, keeps a snapshot of every run, and writes the classes back onto your products so you can filter and act on them across Inventory. This page is the complete manual. Follow it top to bottom and you can install, run your first analysis, read the matrix, tune the thresholds, automate refreshes and fix the common issues without contacting support. Quick start.
1. Open ABC-XYZ > Analyses and click New. 2. Set the Reference Date and the Period (days) to analyse (365 is a good default).
3. Choose the ABC Based On metric: Consumption Value — quantity delivered to customers × cost (the classic choice). Consumption Quantity — units delivered, ignoring cost. On-hand Stock Value — current quantity on hand × cost.
4. Leave Compute XYZ ticked to also classify demand variability. 5. Click Compute.
Reading the matrix. Open an analysis and use the Products stat button, or go to ABC-XYZ > Products: Pivot — ABC classes down the side, XYZ classes across the top, value in each cell. This is your ABC-XYZ matrix: where does value sit, and how predictable is it? Graph — value per ABC-XYZ cell at a glance.
List — every product with its value, cumulative share, ABC, XYZ, combined cell and the recommended stocking policy. How classification works. ABC. Products are sorted by the chosen metric, highest first.
Running totals give each product a cumulative share. Products are class A until the cumulative share reaches the A Threshold (default 80%), class B up to the A + B Threshold (default 80 + 15 = 95%), and C beyond. XYZ. The period is split into Demand Buckets (default 12, i.e.
monthly over a year). For each product the coefficient of variation (CV = standard deviation / mean) of demand across the buckets is measured. CV up to X max CV is X (stable), up to Y max CV is Y (variable), above is Z (erratic). Products with no movement fall into Z.
Tuning the thresholds. Re-run the analysis after any change; results update immediately. A / B Thresholds — move the Pareto cut-offs (their sum must stay below 100). Demand Buckets — more buckets = finer variability detection (needs enough history).
X max CV / Y max CV — tighten or loosen what counts as stable vs erratic. Acting on the classes. When Write Back to Products is on, every product gets an ABC-XYZ tab showing its classes and the analysis it came from, plus filterable fields. In the product list (Inventory > Products): 1.
Group by ABC Class or XYZ Class (search panel > Group By). 2. Filter to ABC Class A or Erratic Demand (Z). 3.
Act on the selection — set reordering rules, adjust safety stock, review suppliers, or plan a phase-out. Recommended policies. Each result line carries a recommended stocking policy for its cell, for example: AX — high value, stable: tight control, automate continuous replenishment, low safety stock. AZ — high value, erratic: make-to-order where possible, careful forecasting.
CZ — low value, erratic: consider phase-out or pure make-to-order. Automating refreshes. A scheduled action ABC-XYZ: Recompute Latest Analysis ships disabled. Enable it under Settings > Technical > Scheduled Actions to recompute the most recent analysis per company on a schedule (weekly by default), moving the reference date to today each run.
Frequently asked questions. A product is missing from the results. For consumption bases, only products with deliveries to customers in the period appear. For the on-hand stock value basis, products with stock on hand are included.
Everything is class A (or class C). The ABC split depends on spread. Check the A/B thresholds and that your cost prices are set, since value = quantity × cost. Support.
Questions or ideas: support@bambooforge.dev. .. BAMBOOFORGE-DOC-APPENDIX (auto-generated: Upgrade/Uninstall/Changelog + bespoke) The complete manual is at docs dot bambooforge dot dev, the demo database is linked from the store page, and support answers within twenty-four hours. Links are in the description.
Transcript of the walkthrough (Odoo 18)
ABC-XYZ Inventory Analysis & Reorder Rules. ABC and XYZ classification for your catalogue, plus Min/Max reorder rules generated from a service level and safety-stock days. Two complementary classifications, combined: In the next few minutes: abc-xyz inventory analysis & reorder rules, then quick start, then reading the matrix, then how classification works, then tuning the thresholds. Then what this app deliberately does not do, so you can tell before you buy whether it fits.
Everything lives under ABC-XYZ then Products then Analyses then Reorder Policies. No Enterprise modules and no external Python libraries are required. ABC-XYZ Inventory Analysis & Reorder Rules. Stop treating every product the same.
This app ranks your catalogue by value (ABC / Pareto) and by demand predictability (XYZ), combines the two into an actionable ABC-XYZ matrix with a stocking recommendation per cell, keeps a snapshot of every run, and writes the classes back onto your products so you can filter and act on them across Inventory. This page is the complete manual. Follow it top to bottom and you can install, run your first analysis, read the matrix, tune the thresholds, automate refreshes and fix the common issues without contacting support. Quick start.
1. Open ABC-XYZ > Analyses and click New. 2. Set the Reference Date and the Period (days) to analyse (365 is a good default).
3. Choose the ABC Based On metric: Consumption Value — quantity delivered to customers × cost (the classic choice). Consumption Quantity — units delivered, ignoring cost. On-hand Stock Value — current quantity on hand × cost.
4. Leave Compute XYZ ticked to also classify demand variability. 5. Click Compute.
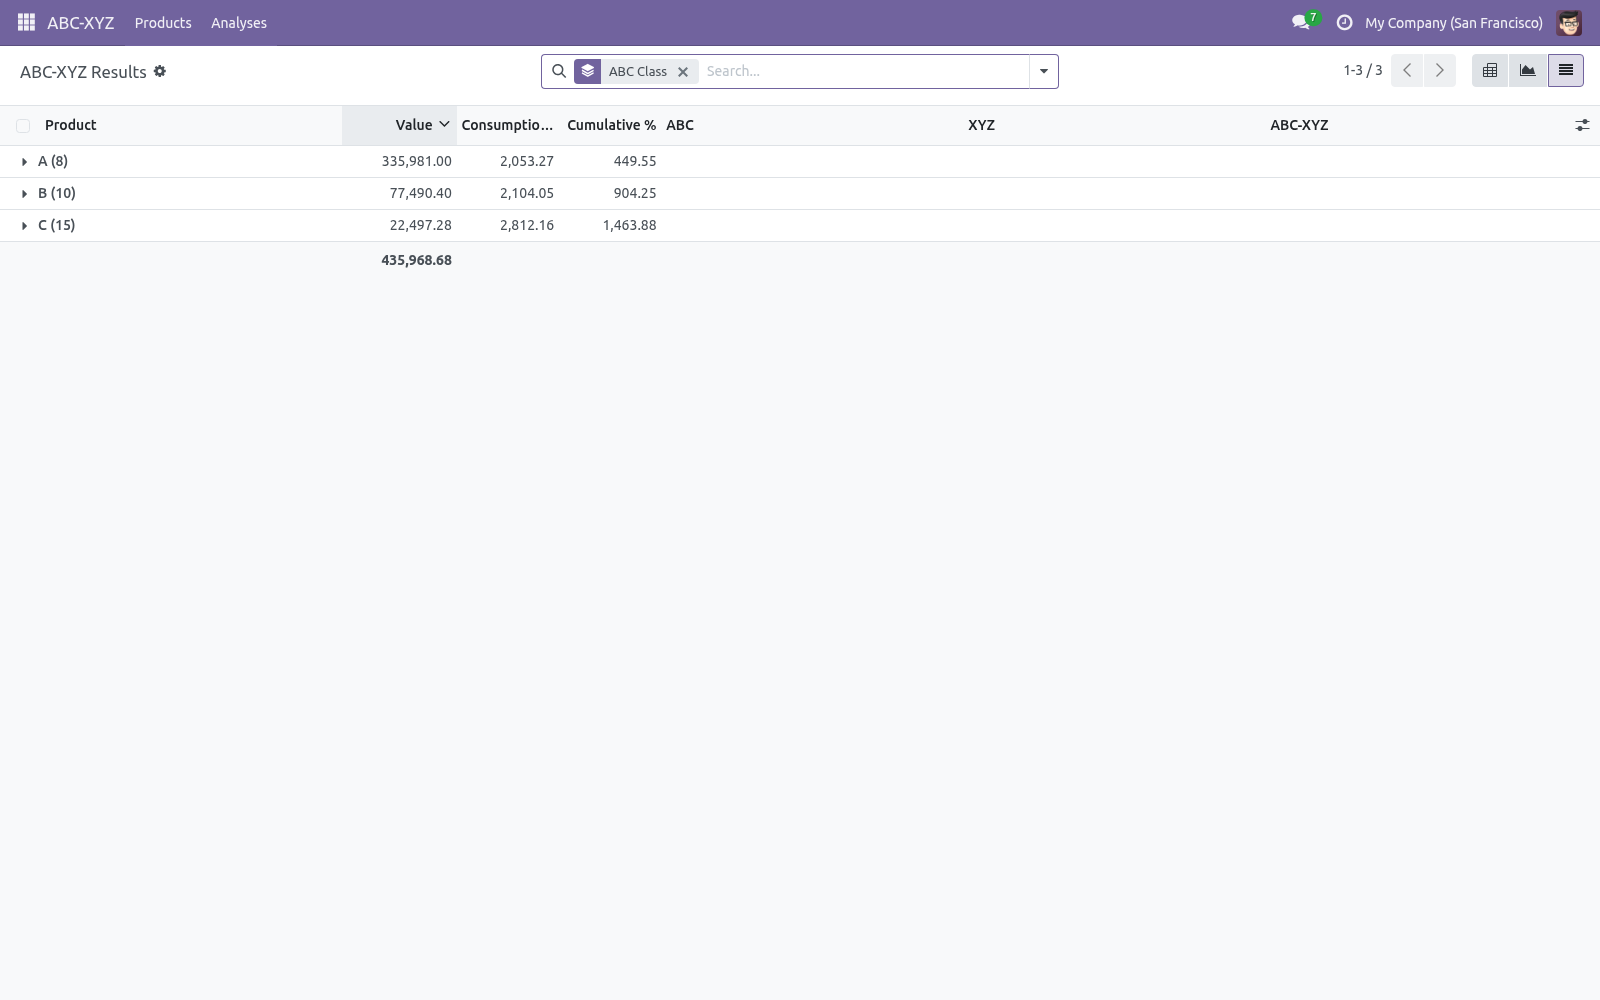
Reading the matrix. Open an analysis and use the Products stat button, or go to ABC-XYZ > Products: Pivot — ABC classes down the side, XYZ classes across the top, value in each cell. This is your ABC-XYZ matrix: where does value sit, and how predictable is it? Graph — value per ABC-XYZ cell at a glance.
List — every product with its value, cumulative share, ABC, XYZ, combined cell and the recommended stocking policy. How classification works. ABC. Products are sorted by the chosen metric, highest first.
Running totals give each product a cumulative share. Products are class A until the cumulative share reaches the A Threshold (default 80%), class B up to the A + B Threshold (default 80 + 15 = 95%), and C beyond. XYZ. The period is split into Demand Buckets (default 12, i.e.
monthly over a year). For each product the coefficient of variation (CV = standard deviation / mean) of demand across the buckets is measured. CV up to X max CV is X (stable), up to Y max CV is Y (variable), above is Z (erratic). Products with no movement fall into Z.
Tuning the thresholds. Re-run the analysis after any change; results update immediately. A / B Thresholds — move the Pareto cut-offs (their sum must stay below 100). Demand Buckets — more buckets = finer variability detection (needs enough history).
X max CV / Y max CV — tighten or loosen what counts as stable vs erratic. Acting on the classes. When Write Back to Products is on, every product gets an ABC-XYZ tab showing its classes and the analysis it came from, plus filterable fields. In the product list (Inventory > Products): 1.
Group by ABC Class or XYZ Class (search panel > Group By). 2. Filter to ABC Class A or Erratic Demand (Z). 3.
Act on the selection — set reordering rules, adjust safety stock, review suppliers, or plan a phase-out. Recommended policies. Each result line carries a recommended stocking policy for its cell, for example: AX — high value, stable: tight control, automate continuous replenishment, low safety stock. AZ — high value, erratic: make-to-order where possible, careful forecasting.
CZ — low value, erratic: consider phase-out or pure make-to-order. Automating refreshes. A scheduled action ABC-XYZ: Recompute Latest Analysis ships disabled. Enable it under Settings > Technical > Scheduled Actions to recompute the most recent analysis per company on a schedule (weekly by default), moving the reference date to today each run.
Frequently asked questions. A product is missing from the results. For consumption bases, only products with deliveries to customers in the period appear. For the on-hand stock value basis, products with stock on hand are included.
Everything is class A (or class C). The ABC split depends on spread. Check the A/B thresholds and that your cost prices are set, since value = quantity × cost. Support.
Questions or ideas: support@bambooforge.dev. .. BAMBOOFORGE-DOC-APPENDIX (auto-generated: Upgrade/Uninstall/Changelog + bespoke) The complete manual is at docs dot bambooforge dot dev, the demo database is linked from the store page, and support answers within twenty-four hours. Links are in the description.
Transcript of the walkthrough (Odoo 17)
ABC-XYZ Inventory Analysis & Reorder Rules. ABC and XYZ classification for your catalogue, plus Min/Max reorder rules generated from a service level and safety-stock days. Two complementary classifications, combined: In the next few minutes: abc-xyz inventory analysis & reorder rules, then quick start, then reading the matrix, then how classification works, then tuning the thresholds. Then what this app deliberately does not do, so you can tell before you buy whether it fits.
Everything lives under ABC-XYZ then Products then Analyses then Reorder Policies. No Enterprise modules and no external Python libraries are required. ABC-XYZ Inventory Analysis & Reorder Rules. Stop treating every product the same.
This app ranks your catalogue by value (ABC / Pareto) and by demand predictability (XYZ), combines the two into an actionable ABC-XYZ matrix with a stocking recommendation per cell, keeps a snapshot of every run, and writes the classes back onto your products so you can filter and act on them across Inventory. This page is the complete manual. Follow it top to bottom and you can install, run your first analysis, read the matrix, tune the thresholds, automate refreshes and fix the common issues without contacting support. Quick start.
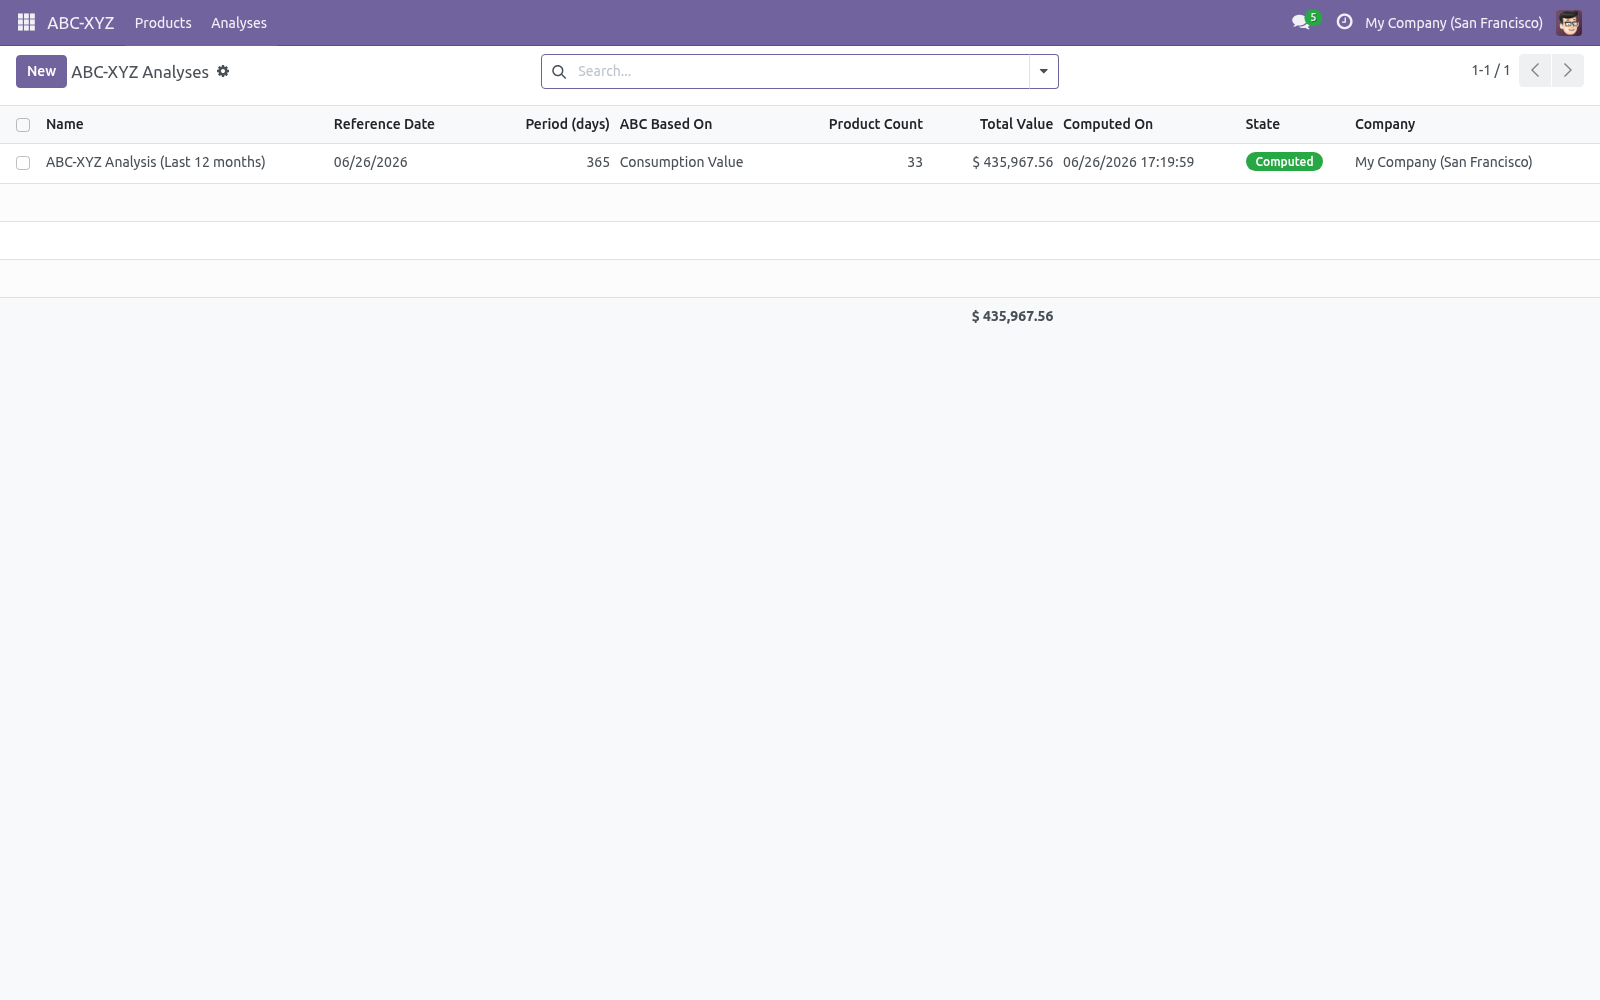
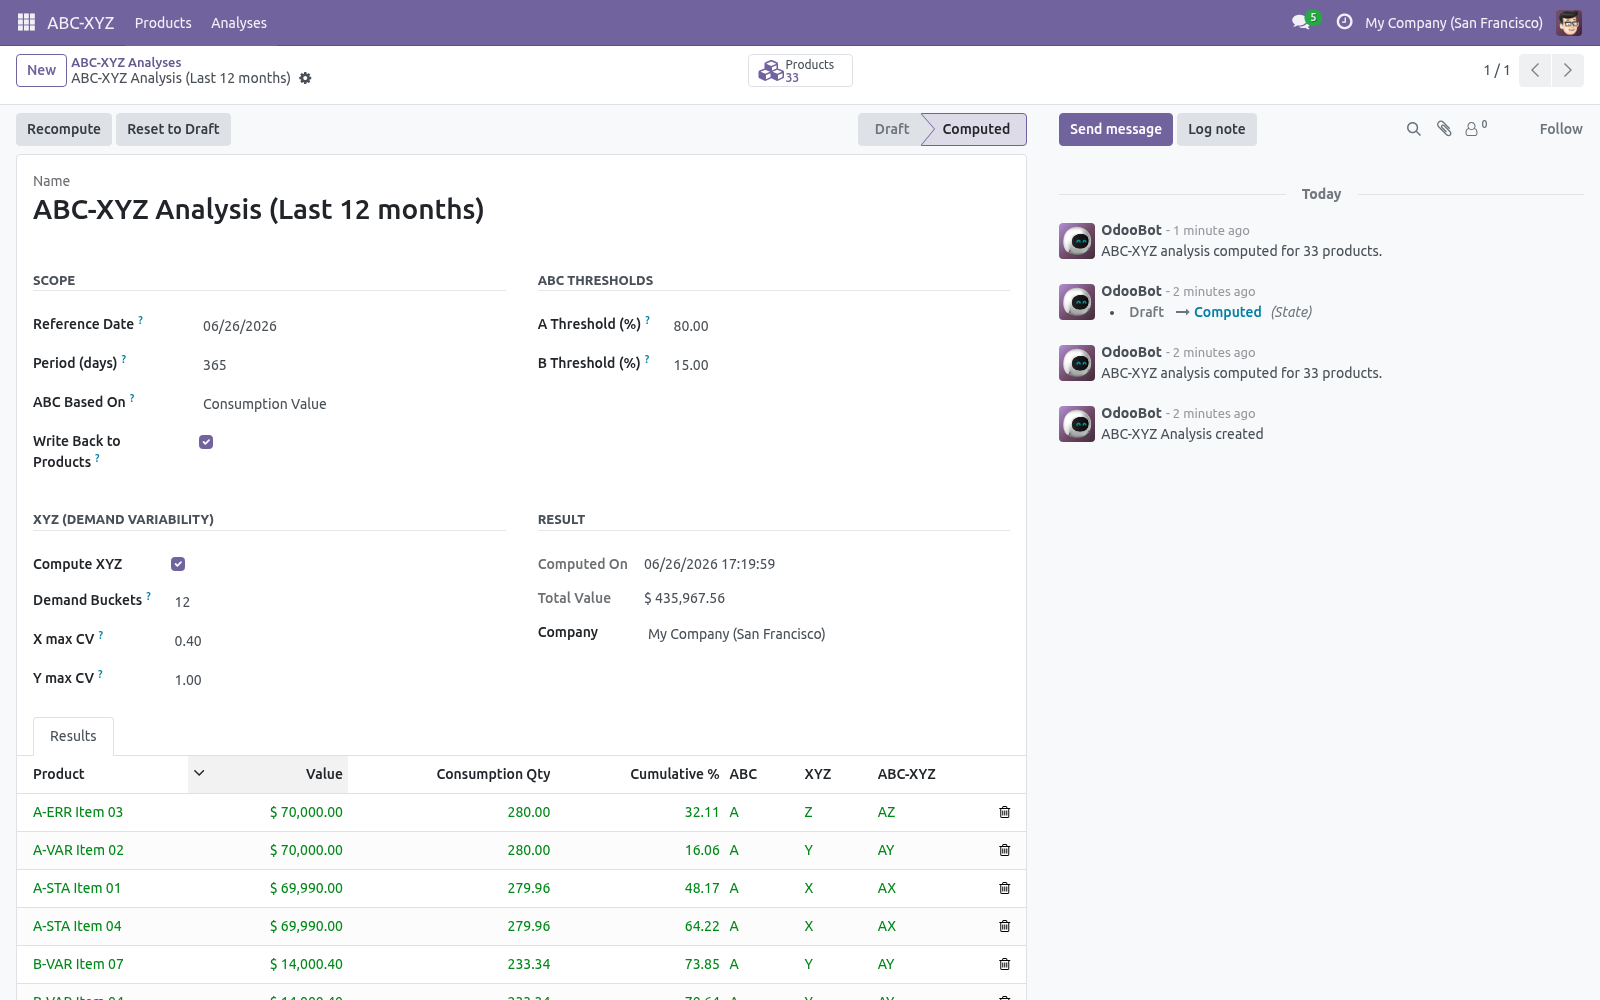
1. Open ABC-XYZ > Analyses and click New. 2. Set the Reference Date and the Period (days) to analyse (365 is a good default).
3. Choose the ABC Based On metric: Consumption Value — quantity delivered to customers × cost (the classic choice). Consumption Quantity — units delivered, ignoring cost. On-hand Stock Value — current quantity on hand × cost.
4. Leave Compute XYZ ticked to also classify demand variability. 5. Click Compute.
Reading the matrix. Open an analysis and use the Products stat button, or go to ABC-XYZ > Products: Pivot — ABC classes down the side, XYZ classes across the top, value in each cell. This is your ABC-XYZ matrix: where does value sit, and how predictable is it? Graph — value per ABC-XYZ cell at a glance.
List — every product with its value, cumulative share, ABC, XYZ, combined cell and the recommended stocking policy. How classification works. ABC. Products are sorted by the chosen metric, highest first.
Running totals give each product a cumulative share. Products are class A until the cumulative share reaches the A Threshold (default 80%), class B up to the A + B Threshold (default 80 + 15 = 95%), and C beyond. XYZ. The period is split into Demand Buckets (default 12, i.e.
monthly over a year). For each product the coefficient of variation (CV = standard deviation / mean) of demand across the buckets is measured. CV up to X max CV is X (stable), up to Y max CV is Y (variable), above is Z (erratic). Products with no movement fall into Z.
Tuning the thresholds. Re-run the analysis after any change; results update immediately. A / B Thresholds — move the Pareto cut-offs (their sum must stay below 100). Demand Buckets — more buckets = finer variability detection (needs enough history).
X max CV / Y max CV — tighten or loosen what counts as stable vs erratic. Acting on the classes. When Write Back to Products is on, every product gets an ABC-XYZ tab showing its classes and the analysis it came from, plus filterable fields. In the product list (Inventory > Products): 1.
Group by ABC Class or XYZ Class (search panel > Group By). 2. Filter to ABC Class A or Erratic Demand (Z). 3.
Act on the selection — set reordering rules, adjust safety stock, review suppliers, or plan a phase-out. Recommended policies. Each result line carries a recommended stocking policy for its cell, for example: AX — high value, stable: tight control, automate continuous replenishment, low safety stock. AZ — high value, erratic: make-to-order where possible, careful forecasting.
CZ — low value, erratic: consider phase-out or pure make-to-order. Automating refreshes. A scheduled action ABC-XYZ: Recompute Latest Analysis ships disabled. Enable it under Settings > Technical > Scheduled Actions to recompute the most recent analysis per company on a schedule (weekly by default), moving the reference date to today each run.
Frequently asked questions. A product is missing from the results. For consumption bases, only products with deliveries to customers in the period appear. For the on-hand stock value basis, products with stock on hand are included.
Everything is class A (or class C). The ABC split depends on spread. Check the A/B thresholds and that your cost prices are set, since value = quantity × cost. Support.
Questions or ideas: support@bambooforge.dev. .. BAMBOOFORGE-DOC-APPENDIX (auto-generated: Upgrade/Uninstall/Changelog + bespoke) The complete manual is at docs dot bambooforge dot dev, the demo database is linked from the store page, and support answers within twenty-four hours. Links are in the description.
Transcript of the walkthrough (Odoo 16)
ABC-XYZ Inventory Analysis & Reorder Rules. ABC and XYZ classification for your catalogue, plus Min/Max reorder rules generated from a service level and safety-stock days. Two complementary classifications, combined: In the next few minutes: abc-xyz inventory analysis & reorder rules, then quick start, then reading the matrix, then how classification works, then tuning the thresholds. Then what this app deliberately does not do, so you can tell before you buy whether it fits.
Everything lives under ABC-XYZ then Products then Analyses then Reorder Policies. No Enterprise modules and no external Python libraries are required. ABC-XYZ Inventory Analysis & Reorder Rules. Stop treating every product the same.
This app ranks your catalogue by value (ABC / Pareto) and by demand predictability (XYZ), combines the two into an actionable ABC-XYZ matrix with a stocking recommendation per cell, keeps a snapshot of every run, and writes the classes back onto your products so you can filter and act on them across Inventory. This page is the complete manual. Follow it top to bottom and you can install, run your first analysis, read the matrix, tune the thresholds, automate refreshes and fix the common issues without contacting support. Quick start.
1. Open ABC-XYZ > Analyses and click New. 2. Set the Reference Date and the Period (days) to analyse (365 is a good default).
3. Choose the ABC Based On metric: Consumption Value — quantity delivered to customers × cost (the classic choice). Consumption Quantity — units delivered, ignoring cost. On-hand Stock Value — current quantity on hand × cost.
4. Leave Compute XYZ ticked to also classify demand variability. 5. Click Compute.
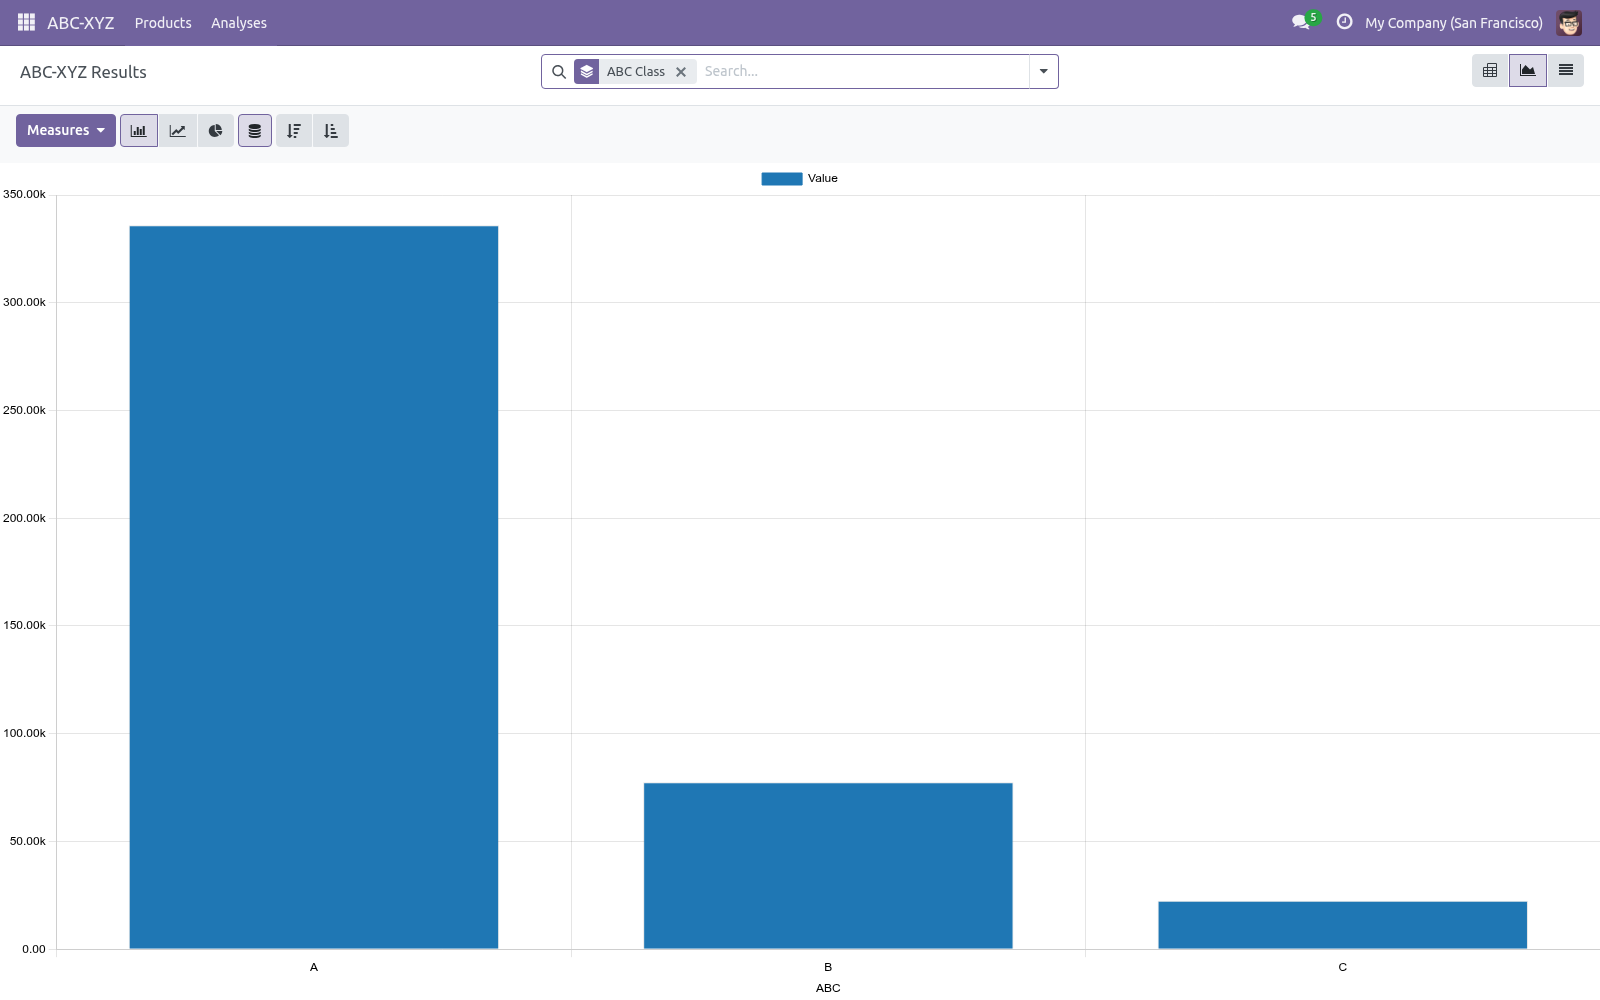
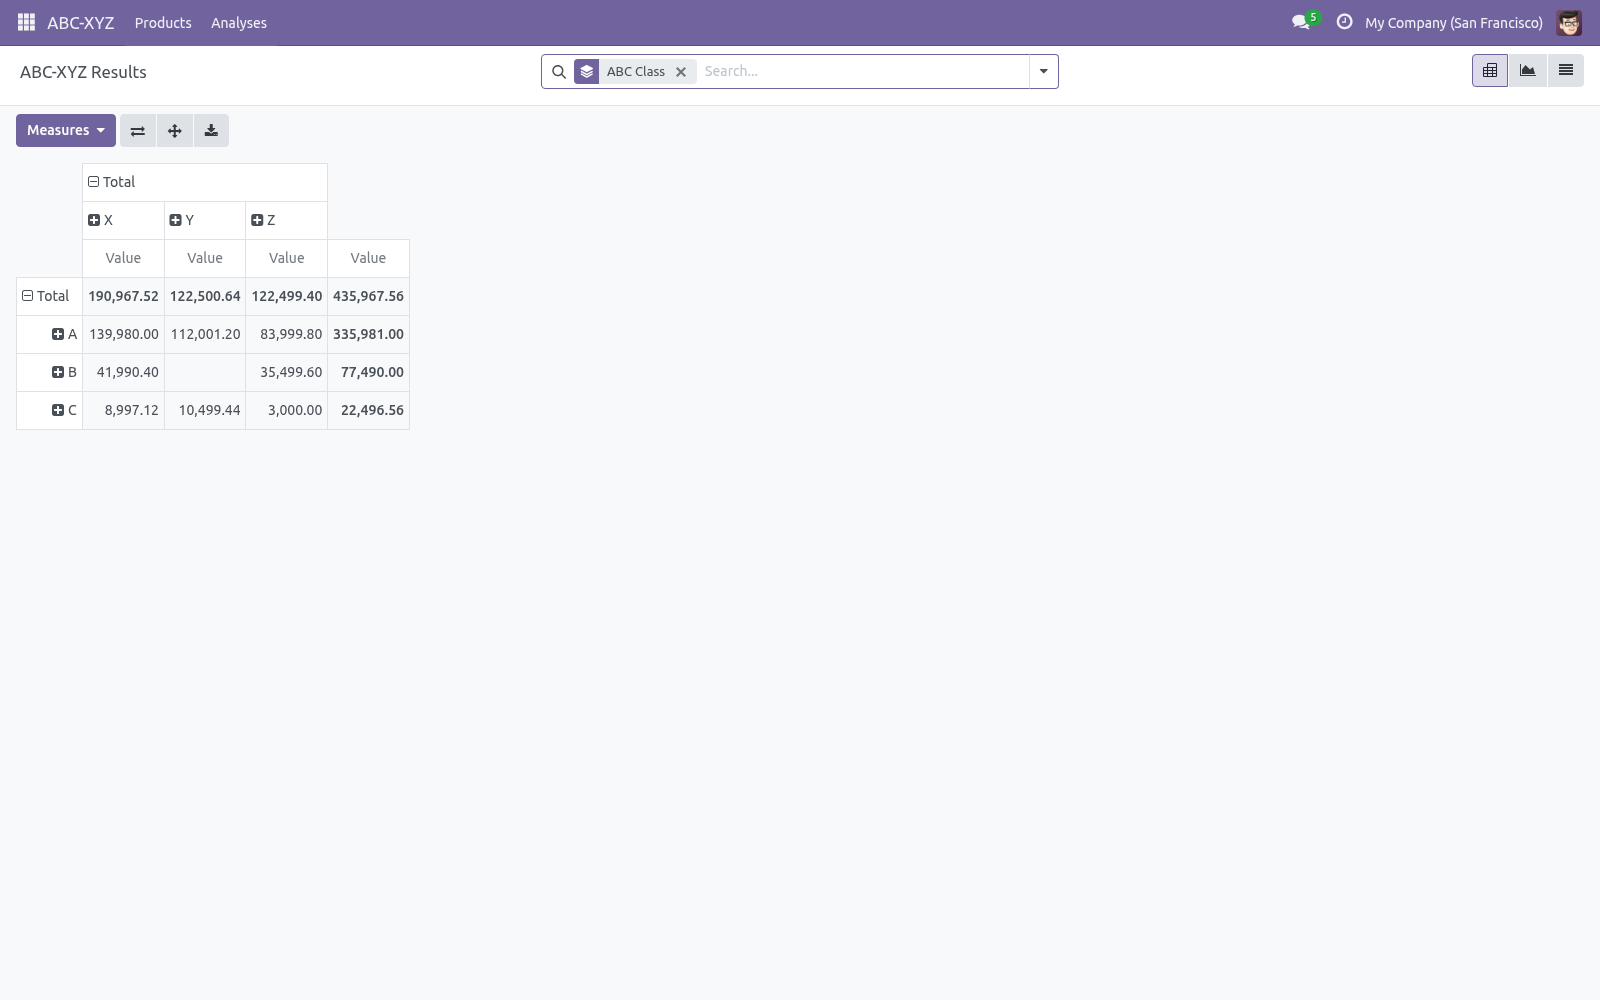
Reading the matrix. Open an analysis and use the Products stat button, or go to ABC-XYZ > Products: Pivot — ABC classes down the side, XYZ classes across the top, value in each cell. This is your ABC-XYZ matrix: where does value sit, and how predictable is it? Graph — value per ABC-XYZ cell at a glance.
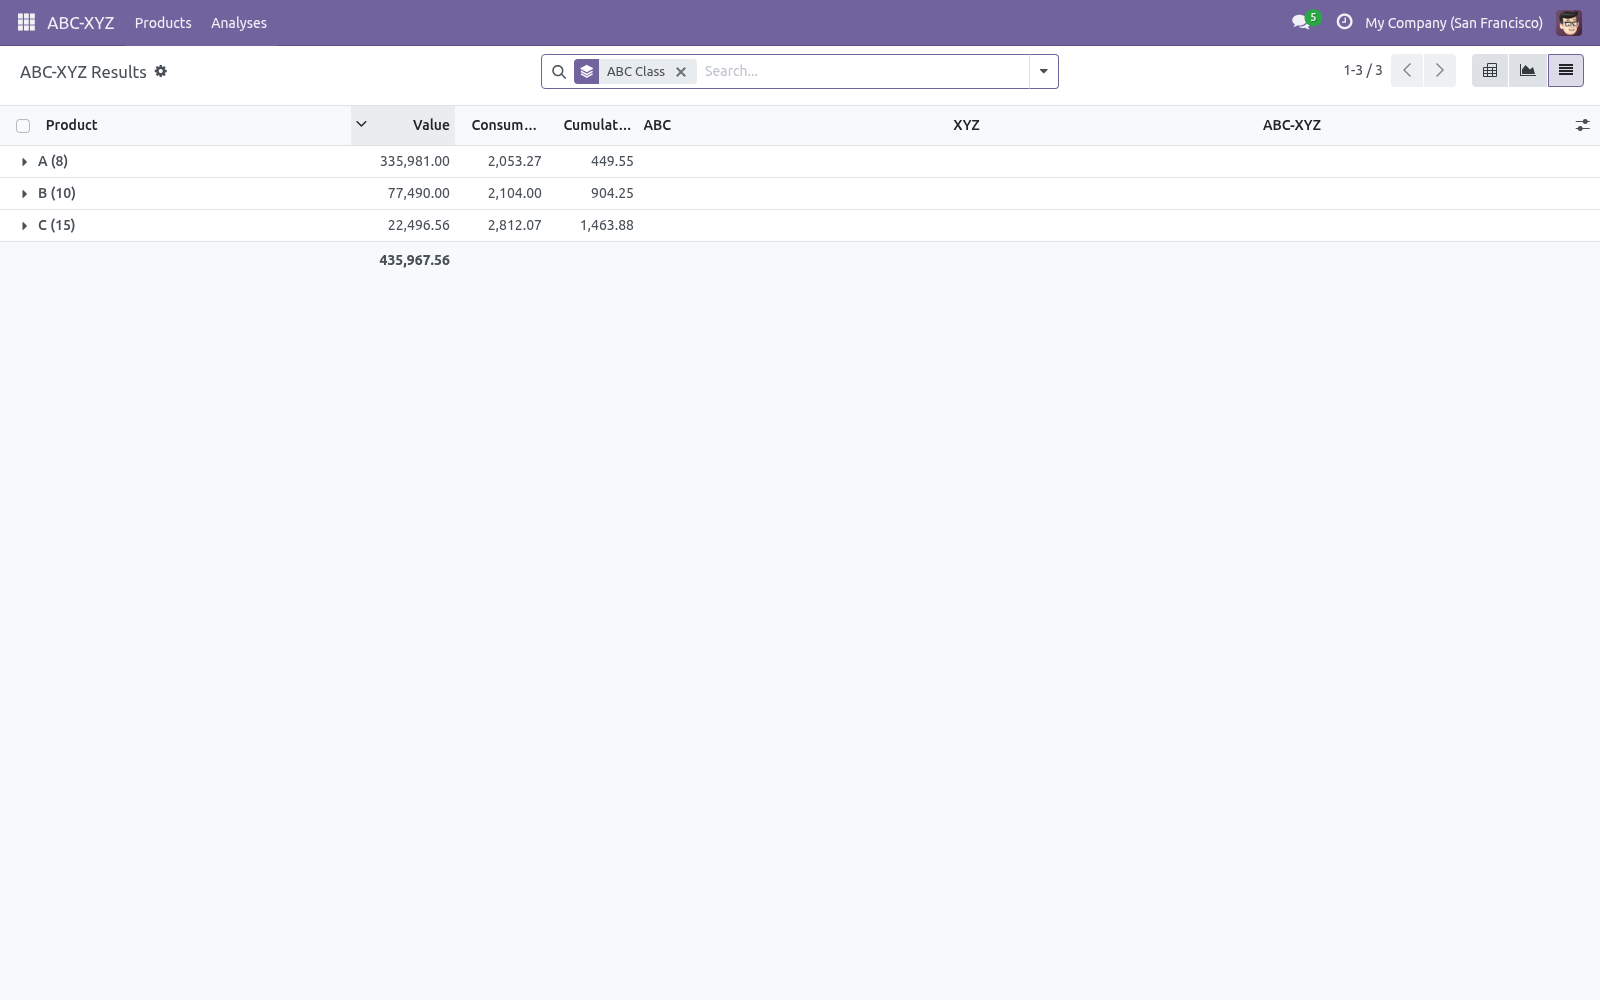
List — every product with its value, cumulative share, ABC, XYZ, combined cell and the recommended stocking policy. How classification works. ABC. Products are sorted by the chosen metric, highest first.
Running totals give each product a cumulative share. Products are class A until the cumulative share reaches the A Threshold (default 80%), class B up to the A + B Threshold (default 80 + 15 = 95%), and C beyond. XYZ. The period is split into Demand Buckets (default 12, i.e.
monthly over a year). For each product the coefficient of variation (CV = standard deviation / mean) of demand across the buckets is measured. CV up to X max CV is X (stable), up to Y max CV is Y (variable), above is Z (erratic). Products with no movement fall into Z.
Tuning the thresholds. Re-run the analysis after any change; results update immediately. A / B Thresholds — move the Pareto cut-offs (their sum must stay below 100). Demand Buckets — more buckets = finer variability detection (needs enough history).
X max CV / Y max CV — tighten or loosen what counts as stable vs erratic. Acting on the classes. When Write Back to Products is on, every product gets an ABC-XYZ tab showing its classes and the analysis it came from, plus filterable fields. In the product list (Inventory > Products): 1.
Group by ABC Class or XYZ Class (search panel > Group By). 2. Filter to ABC Class A or Erratic Demand (Z). 3.
Act on the selection — set reordering rules, adjust safety stock, review suppliers, or plan a phase-out. Recommended policies. Each result line carries a recommended stocking policy for its cell, for example: AX — high value, stable: tight control, automate continuous replenishment, low safety stock. AZ — high value, erratic: make-to-order where possible, careful forecasting.
CZ — low value, erratic: consider phase-out or pure make-to-order. Automating refreshes. A scheduled action ABC-XYZ: Recompute Latest Analysis ships disabled. Enable it under Settings > Technical > Scheduled Actions to recompute the most recent analysis per company on a schedule (weekly by default), moving the reference date to today each run.
Frequently asked questions. A product is missing from the results. For consumption bases, only products with deliveries to customers in the period appear. For the on-hand stock value basis, products with stock on hand are included.
Everything is class A (or class C). The ABC split depends on spread. Check the A/B thresholds and that your cost prices are set, since value = quantity × cost. Support.
Questions or ideas: support@bambooforge.dev. .. BAMBOOFORGE-DOC-APPENDIX (auto-generated: Upgrade/Uninstall/Changelog + bespoke) The complete manual is at docs dot bambooforge dot dev, the demo database is linked from the store page, and support answers within twenty-four hours. Links are in the description.
Key facts
- What it is
- ABC and XYZ classification for your catalogue, plus Min/Max reorder rules generated from a service level and safety-stock days.
- For
- Warehouse
- Odoo versions
- 16.0, 17.0, 18.0, 19.0, 20.0 - Community and Enterprise
- Runs on
- Odoo.sh or Odoo you host yourself - not Odoo Online, which accepts no third-party apps
- Price
- 99 EUR, one-time, on the Odoo Apps Store
- Technical name
- bambooforge_abc_analysis
- Live demo
- https://demo20.bambooforge.dev/odoo/action-bambooforge_abc_analysis.abc_analysis_line_action
- Manual last updated
- 2026-10-15
ABC-XYZ Inventory Analysis & Reorder Rules
Stop treating every product the same. This app ranks your catalogue by value (ABC / Pareto) and by demand predictability (XYZ), combines the two into an actionable ABC-XYZ matrix with a stocking recommendation per cell, keeps a snapshot of every run, and writes the classes back onto your products so you can filter and act on them across Inventory.
This page is the complete manual. Follow it top to bottom and you can install, run your first analysis, read the matrix, tune the thresholds, automate refreshes and fix the common issues without contacting support.
Overview
Two complementary classifications, combined:
ABC (value) — the Pareto principle applied to inventory. A small share of products usually drives most of the value. Class A is the vital few, B the middle, C the trivial many.
XYZ (demand variability) — how predictable a product's demand is. X is stable and easy to forecast, Y is variable, Z is erratic.
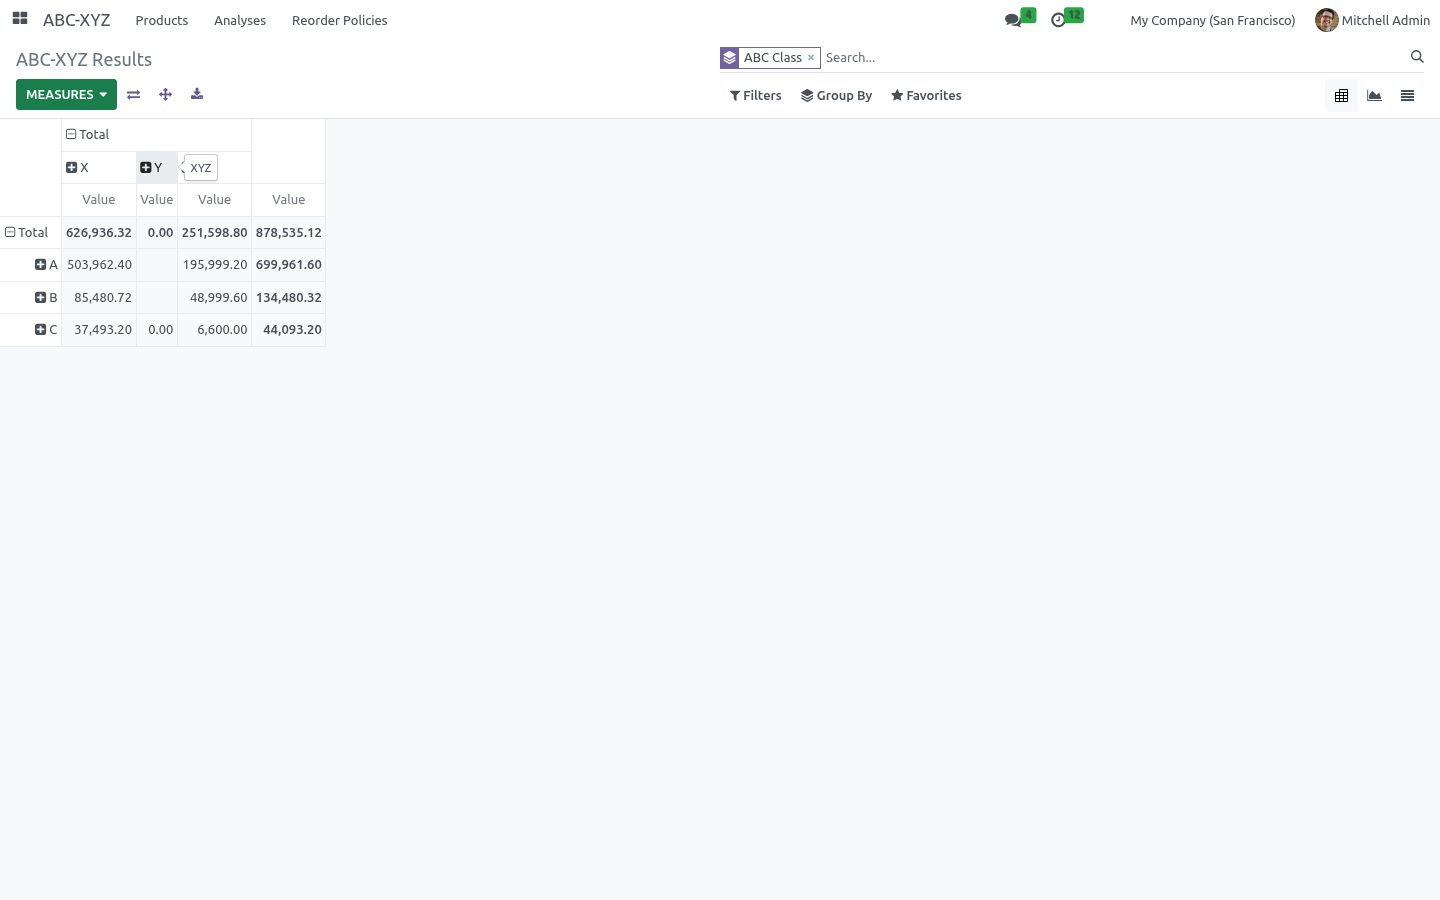
Cross them and you get a 9-cell ABC-XYZ matrix. An AX product (high value, stable) deserves tight, automated replenishment with low safety stock; a CZ product (low value, erratic) is a phase-out or make-to-order candidate. The app spells out a recommended policy for every cell.
It gives you:
Re-runnable analyses — each keeps its own snapshot of results.
Configurable ABC — choose the value basis and the A/B thresholds.
Configurable XYZ — choose the number of demand buckets and the variability cut-offs.
Write-back to products — ABC, XYZ and the combined cell stored on each product for filtering and grouping across Inventory.
Matrix pivot, graph and list of the results, plus a per-cell policy.
Optional weekly cron to keep the latest analysis fresh.
Requirements
Odoo 20.0.
The Inventory app (stock). Installing this app pulls it in automatically.
No Enterprise modules and no external Python libraries are required.
Installation
Copy bambooforge_abc_analysis into your addons path.
Update the apps list (Apps > Update Apps List).
Search for ABC-XYZ and click Install.
A new top-level ABC-XYZ app appears, and an ABC-XYZ Analysis entry is added under Inventory > Reporting.
Quick start
Open ABC-XYZ > Analyses and click New.
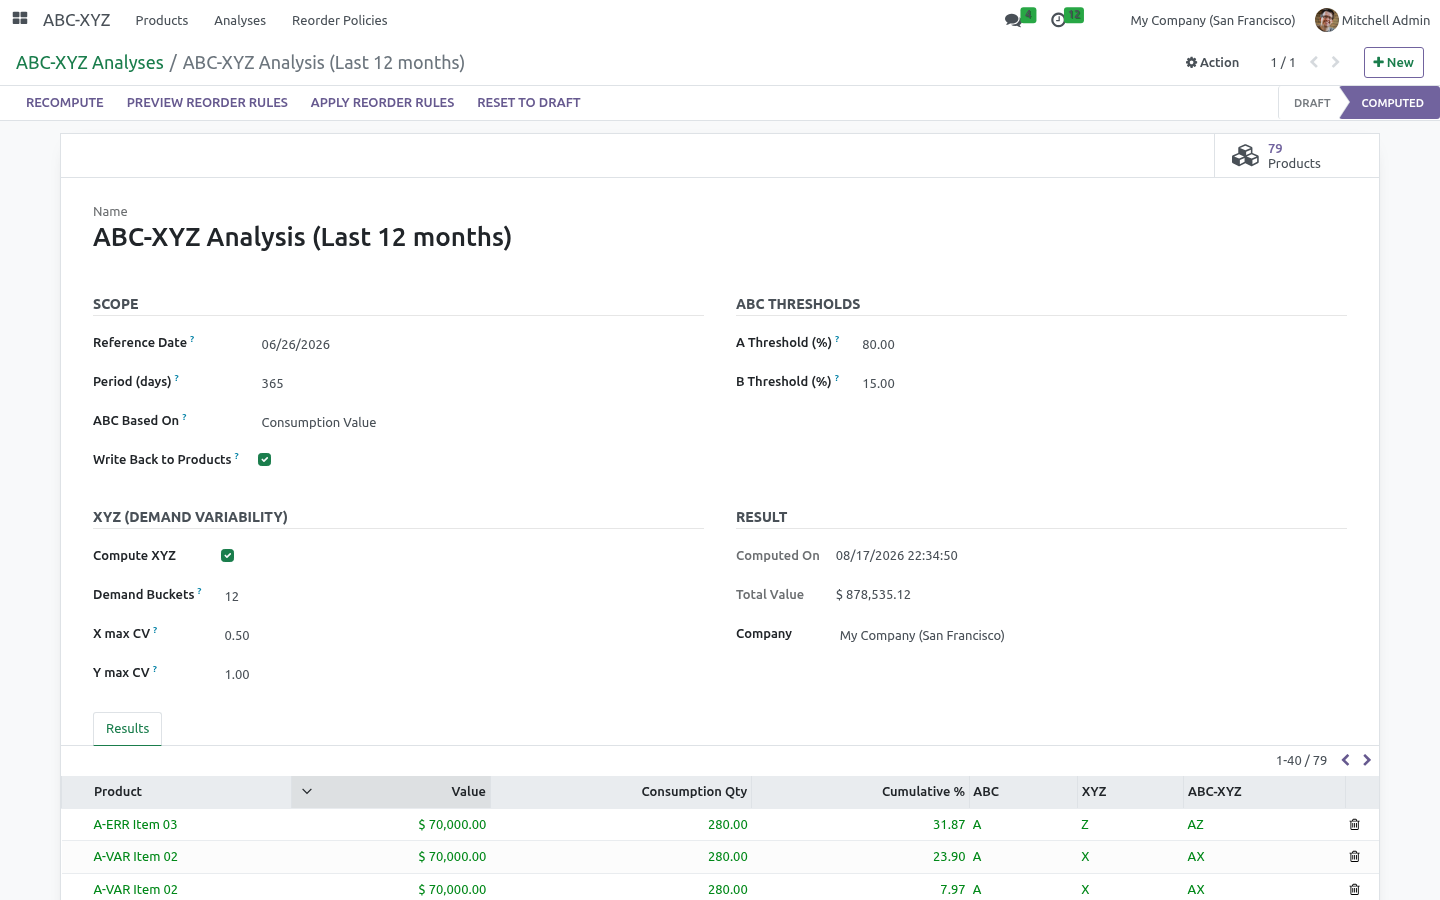
Set the Reference Date and the Period (days) to analyse (365 is a good default).
Choose the ABC Based On metric:
Consumption Value — quantity delivered to customers × cost (the classic choice).
Consumption Quantity — units delivered, ignoring cost.
On-hand Stock Value — current quantity on hand × cost.
Leave Compute XYZ ticked to also classify demand variability.
Click Compute.
The analysis switches to Computed, the Products stat fills in, and the Results tab lists every product with its value, classes and combined cell.
Reading the matrix
Open an analysis and use the Products stat button, or go to ABC-XYZ > Products:
Pivot — ABC classes down the side, XYZ classes across the top, value in each cell. This is your ABC-XYZ matrix: where does value sit, and how predictable is it?
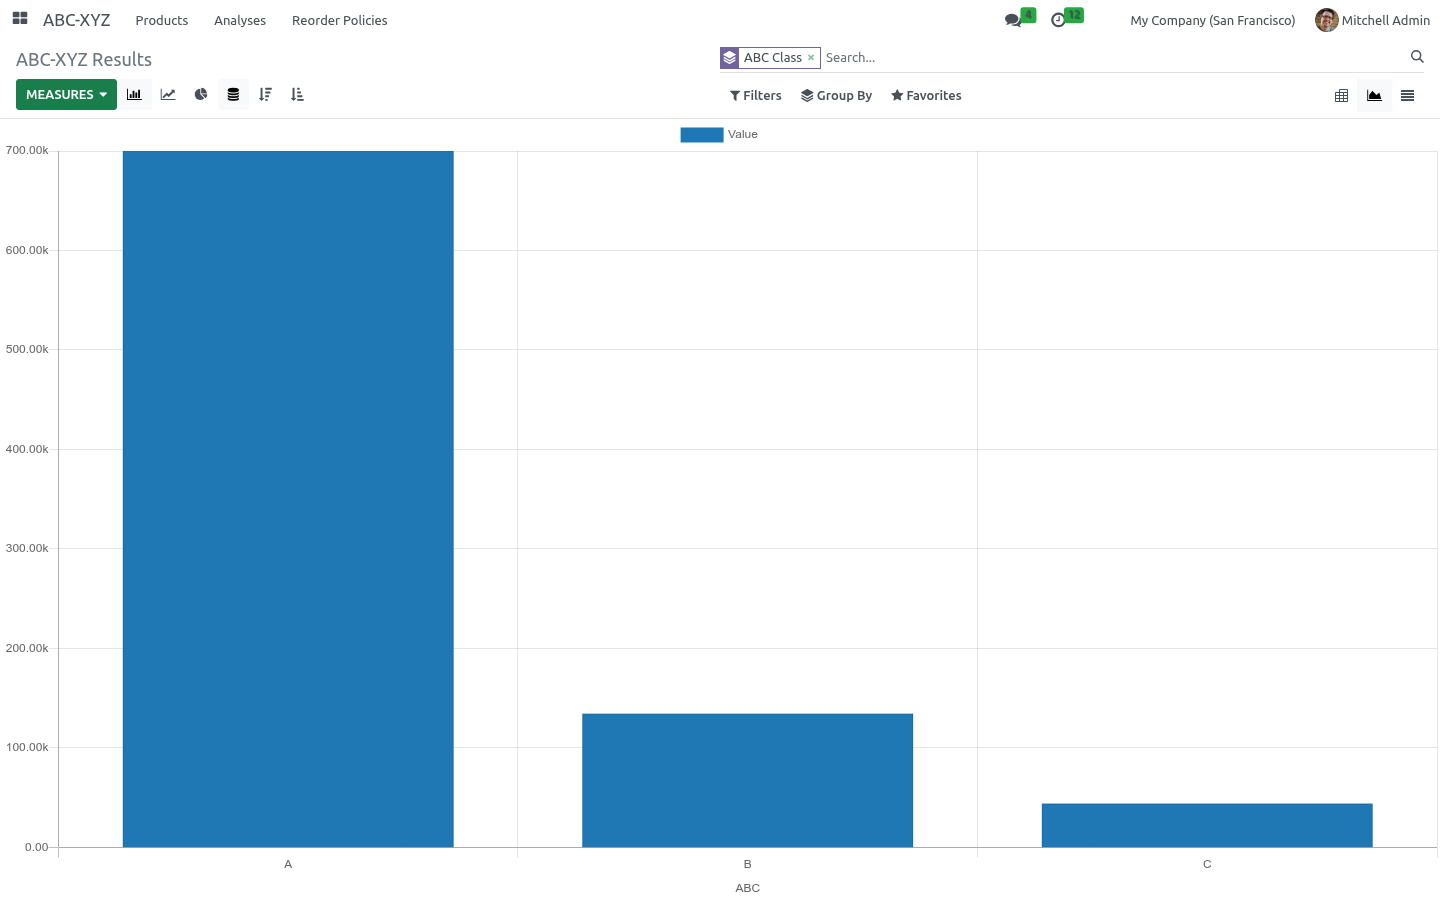
Graph — value per ABC-XYZ cell at a glance.
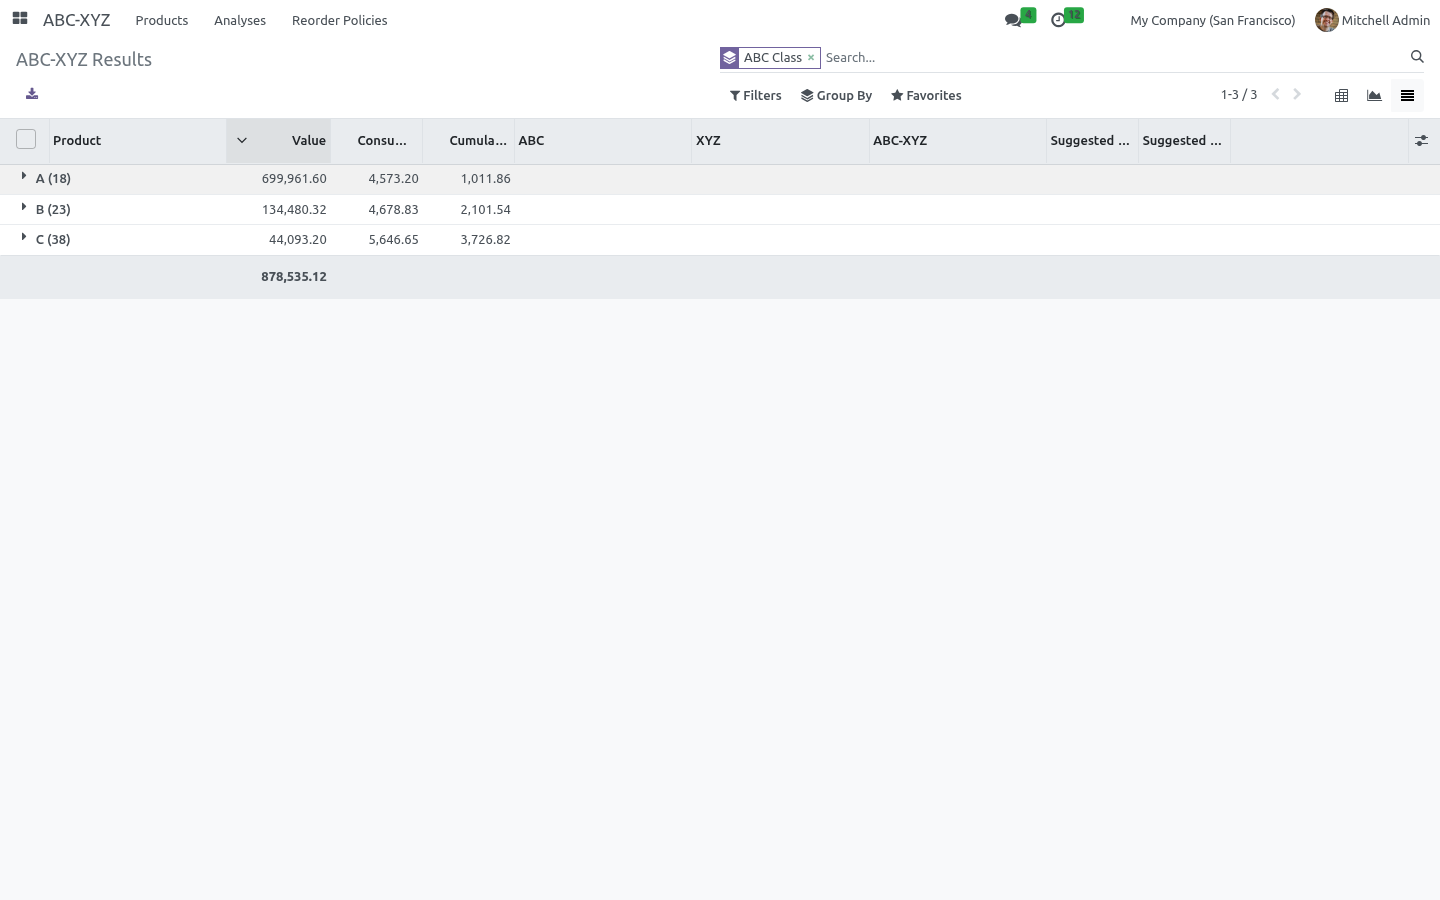
List — every product with its value, cumulative share, ABC, XYZ, combined cell and the recommended stocking policy.
How classification works
ABC. Products are sorted by the chosen metric, highest first. Running totals give each product a cumulative share. Products are class A until the cumulative share reaches the A Threshold (default 80%), class B up to the A + B Threshold (default 80 + 15 = 95%), and C beyond.
XYZ. The period is split into Demand Buckets (default 12, i.e. monthly over a year). For each product the coefficient of variation (CV = standard deviation / mean) of demand across the buckets is measured. CV up to X max CV is X (stable), up to Y max CV is Y (variable), above is Z (erratic). Products with no movement fall into Z.
All values are expressed in the company currency.
Tuning the thresholds
Everything is on the analysis form:
A / B Thresholds — move the Pareto cut-offs (their sum must stay below 100).
Demand Buckets — more buckets = finer variability detection (needs enough history).
X max CV / Y max CV — tighten or loosen what counts as stable vs erratic.
Re-run the analysis after any change; results update immediately.
Acting on the classes
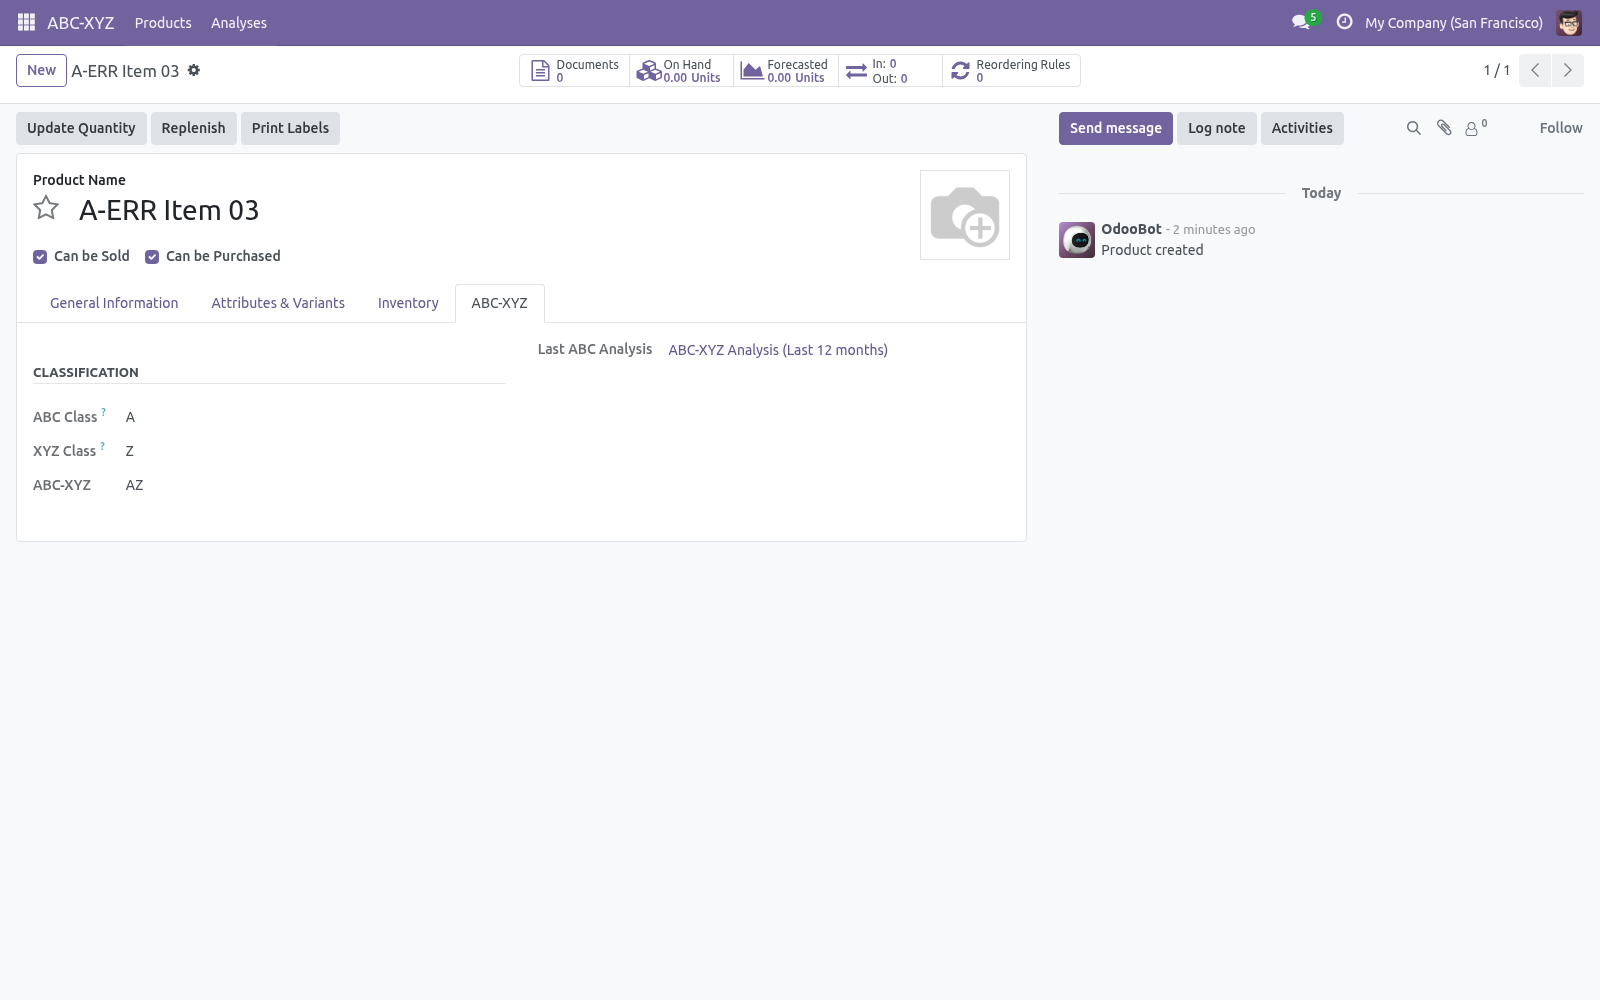
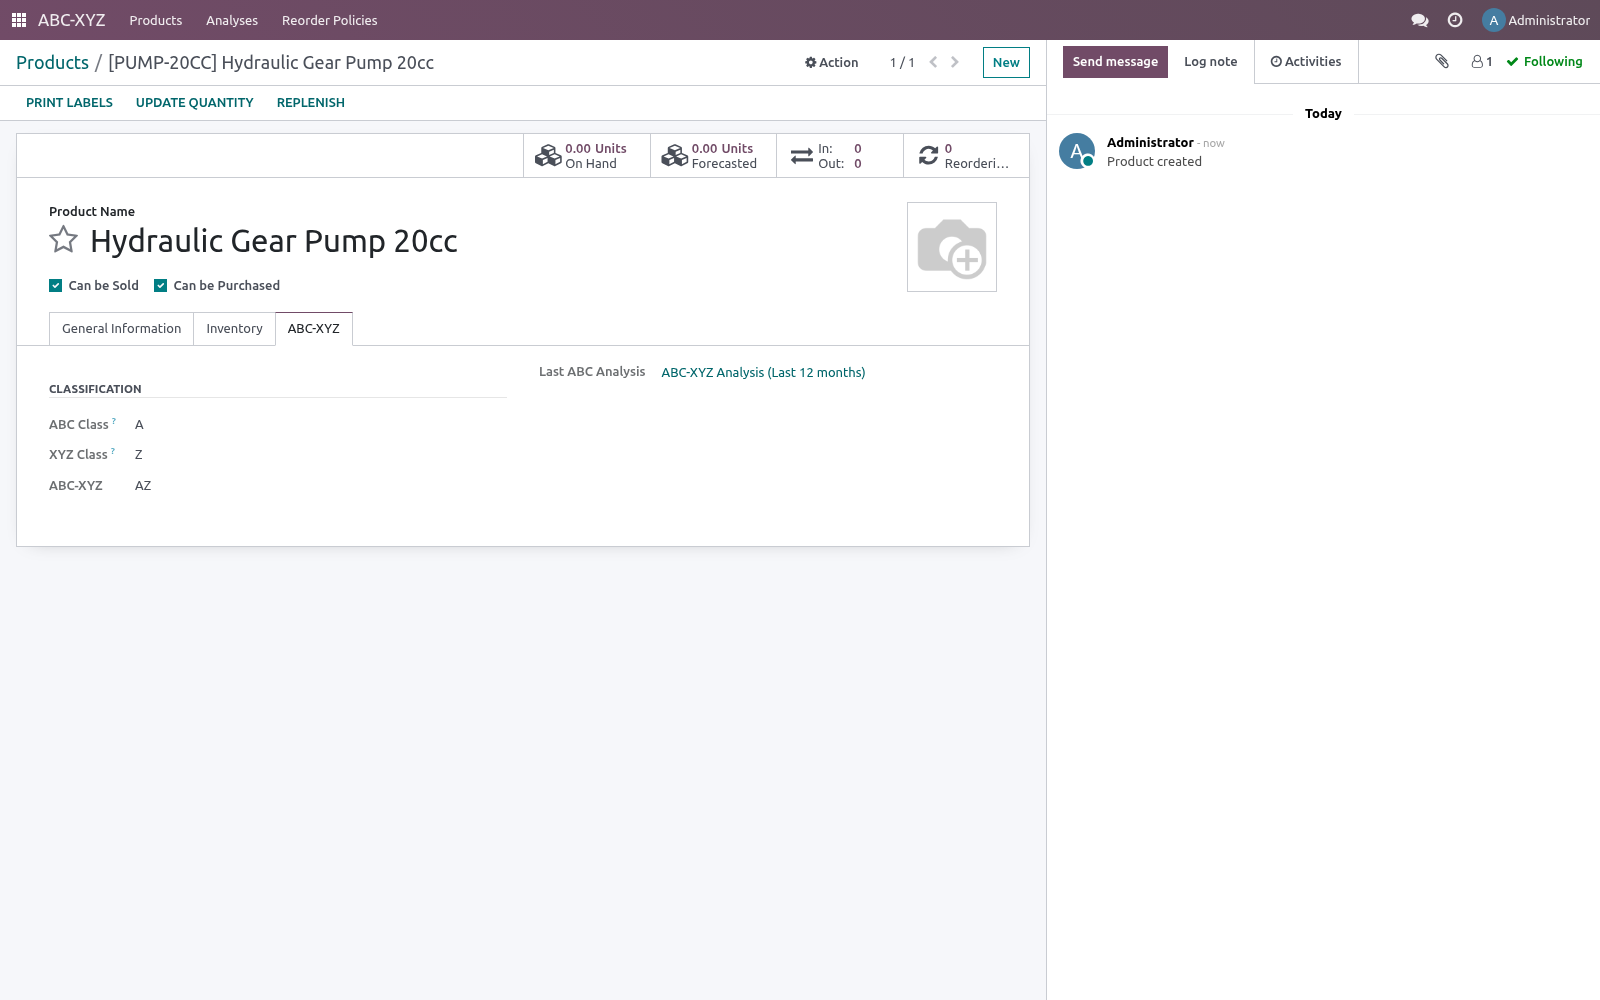
When Write Back to Products is on, every product gets an ABC-XYZ tab showing its classes and the analysis it came from, plus filterable fields. In the product list (Inventory > Products):
Group by ABC Class or XYZ Class (search panel > Group By).
Filter to ABC Class A or Erratic Demand (Z).
Act on the selection — set reordering rules, adjust safety stock, review suppliers, or plan a phase-out.
Recommended policies
Each result line carries a recommended stocking policy for its cell, for example:
AX — high value, stable: tight control, automate continuous replenishment, low safety stock.
AZ — high value, erratic: make-to-order where possible, careful forecasting.
CZ — low value, erratic: consider phase-out or pure make-to-order.
Automating refreshes
A scheduled action ABC-XYZ: Recompute Latest Analysis ships disabled. Enable it under Settings > Technical > Scheduled Actions to recompute the most recent analysis per company on a schedule (weekly by default), moving the reference date to today each run.
Frequently asked questions
- A product is missing from the results.
For consumption bases, only products with deliveries to customers in the period appear. For the on-hand stock value basis, products with stock on hand are included.
- Everything is class A (or class C).
The ABC split depends on spread. Check the A/B thresholds and that your cost prices are set, since value = quantity × cost.
- All products are class Z.
XYZ needs demand spread across several buckets. With little history, or demand concentrated in one bucket, the variation is high by definition. Lower the bucket count or widen the CV cut-offs.
- Does it work with product variants?
Classification is computed from delivery moves (per variant) and written back to the product. For variant-heavy catalogues, treat the class as a product-level signal.
- Does it work with multiple companies?
Yes. Each analysis is scoped to one company, and results are kept separate per company.
How we make sure it works
Before every release, 21 automated checks run against this app on Odoo 16, 17, 18, 19 and 20. Among them:
Defaults do not write orderpoints by themselves.
Preview does not write when auto off.
Manual orderpoint not touched.
A shipment after the company's midnight stays out.
Reapply updates no duplicate.
The complete list is in the source you receive.
Support
Questions or ideas: support@bambooforge.dev.
Usage
This section walks through a full working cycle: run an analysis, read the results, define reorder policies and let the app maintain your Min/Max reorder rules. It all lives under the top-level ABC-XYZ menu (Inventory users), with manager-only pieces called out below.
Run an analysis
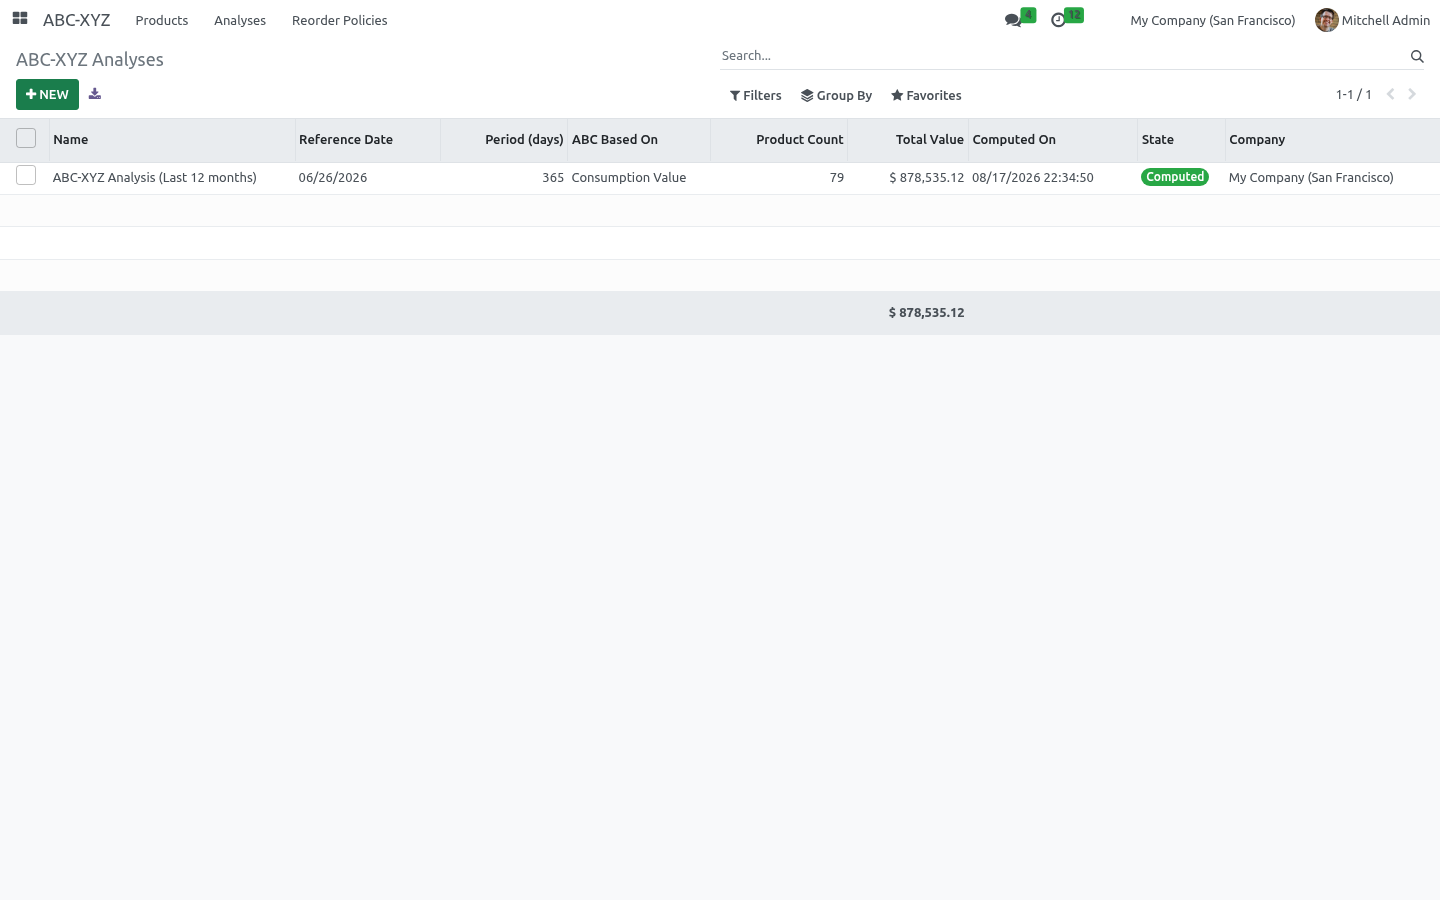
Open ABC-XYZ > Analyses and click New. The reference is filled from an ABC/##### sequence, so you never have to name it.
In the Scope group set:
Reference Date — the analysis is measured up to this day (defaults to today).
Period (days) — how far back demand and consumption are measured; 365 is the usual choice.
ABC Based On — Consumption Value (delivered qty x cost), Consumption Quantity, or On-hand Stock Value.
Write Back to Products — leave on to store the classes on each product.
Tune the ABC Thresholds and, if Compute XYZ is ticked, the Demand Buckets and X max CV / Y max CV on the right.
Click Compute. The status moves to Computed, the Products stat button fills in, the Results tab lists every product (A rows highlighted green, C rows muted), and a note is logged in the chatter.
To refresh an existing analysis, open it and click Recompute (it re-reads moves up to the current reference date); Reset to Draft clears the results.
Read the results
Open ABC-XYZ > Products (or the Products stat button on an analysis) to explore the same result lines as a Pivot, Graph and List, grouped by ABC class by default. The pivot with ABC down the side and XYZ across the top is your ABC-XYZ matrix; each list line carries the product, Value, Cumulative %, ABC, XYZ, combined ABC-XYZ cell and a plain-language stocking recommendation. Products also gain an ABC-XYZ tab and filterable ABC/XYZ fields, so in Inventory > Products you can group by ABC Class or XYZ Class and act on, say, every A item or every erratic (Z) item at once.
Define reorder policies
A manager opens ABC-XYZ > Reorder Policies (requires Inventory / Manager) and creates one policy per class cell:
Under Applies To, pick the ABC Class (required), optionally an XYZ Class (blank = every XYZ class in that ABC class), the Warehouse, and optionally a Product Category. A more specific policy (pinned XYZ and/or category) wins over a wildcard one.
Under Reorder Parameters, set the Service Level (%), Safety Stock (days), Lead Time (days), Target Cover (days) and Qty Multiple. The app sizes the reorder point from lead-time demand plus a safety buffer (the larger of the service-level buffer and the days-of-cover floor), and the Max from the target cover.
Leave Auto-create Reorder Rules off to stay in preview, or turn it on to let the app write real rules for matching products.
Example. An AX policy with service level 99%, 3 safety days and a 14-day target cover keeps high-value stable items tightly stocked, while a CZ policy left in preview merely flags low-value erratic items without touching any rule.
Apply the rules
On a Computed analysis, click Preview Reorder Rules to see the Suggested Min / Suggested Max and matched Policy for every line without changing anything. When you are happy, click Apply Reorder Rules and confirm: the app creates or updates stock.warehouse.orderpoint Min/Max rules only for products matched by a policy with auto-create on. It is completely safe and idempotent - it only ever touches the reorder rules it created, so manually-created rules are counted as left untouched and never overwritten. A notification reports how many rules were created, updated and skipped.
Automate the cycle
Two scheduled actions ship disabled under Settings > Technical > Scheduled Actions: ABC-XYZ: Recompute Latest Analysis re-runs the most recent analysis per company (moving the reference date to today), and ABC-XYZ: Sync Reorder Rules keeps auto-create policies' reorder rules aligned to the latest demand. Enable them to run the whole classify-then-replenish loop hands-off.
Upgrading & version compatibility
This build targets Odoo 20.0. Each Odoo major series (16.0, 17.0, 18.0, 19.0, 20.0) has its own dedicated build of this module — always install the build that matches your Odoo version. Mixing a build with a different Odoo series is not supported.
Patch upgrades (same series, e.g. 20.0.1.0.0 → later)
Back up your database and filestore first.
Replace the module folder with the newer build.
Restart Odoo with the module updated:
./odoo-bin -c your.conf -u bambooforge_abc_analysis -d your_db
Odoo applies any schema/data changes automatically. Your existing records and configuration are preserved.
Cross-version migration (moving to a newer Odoo)
Upgrading Odoo itself is a database migration handled by Odoo's standard upgrade tooling. When you migrate the database to the next Odoo series, install the matching build of this module for that series. Data created by this module carries over with the database migration.
After any upgrade the module's scheduled actions resume on their normal cadence — no manual re-activation is required.
Uninstallation
You can remove this module at any time from Apps → (this module) → Uninstall, or from the command line. Uninstalling is clean and reversible by reinstalling — but note what is and is not deleted.
What is removed
The module's own tables and every record in them (3 models, prefixed abc.*) — this is the data this module created.
The menus, actions, views and reports this module installed.
Its scheduled actions (cron jobs) — they stop immediately on uninstall.
What is preserved
Your standard Odoo data (partners, products, sales, invoices, inventory moves) is not deleted — this module only reads and annotates it; the underlying records stay.
Attachments and chatter messages on standard records are kept.
As always, take a database backup before uninstalling in production.
Questions people ask
- Which Odoo versions does it run on?
Odoo 16.0, 17.0, 18.0, 19.0, 20.0, on the series you buy it for; each series is its own listing.
- Community or Enterprise?
Both. It needs no Enterprise app.
- What does it need?
The standard Inventory app. No extra Python package.
- Where does it show up?
Under the ABC-XYZ menu (Products, Analyses, Reorder Policies).
- Does anything leave my server?
No. It makes no call outside your Odoo server: no telemetry, no licence check, no third-party service.
- What happens if I uninstall it?
Odoo drops the app's own tables and fields; the standard records it worked on (contacts, orders, products) stay as they are.
Changelog
20.0.1.1.2
Built for Odoo 20: record rules and access rights rewritten onto Odoo 20's single ir.access model, the screens rebuilt on Owl 3, and every icon moved to the icon set Odoo 20 ships.
20.0.1.0.0
Current release for Odoo 20.0. This build includes:
Auto-generate ABC-driven reorder rules (Min/Max orderpoints) from a service level and safety-stock days, opt-in and never touching manual rules. Also classify products with ABC (Pareto value) and XYZ (demand variability) analysis, combine them into a 9-cell ABC-XYZ matrix with stocking policies, snapshot over time and write the classes back onto products.
Feature additions and fixes ship as new builds on the Odoo Apps store; this page and the module's version reflect the current published release. Always keep the build matched to your Odoo series (see Upgrading & version compatibility).